Industrial Properties
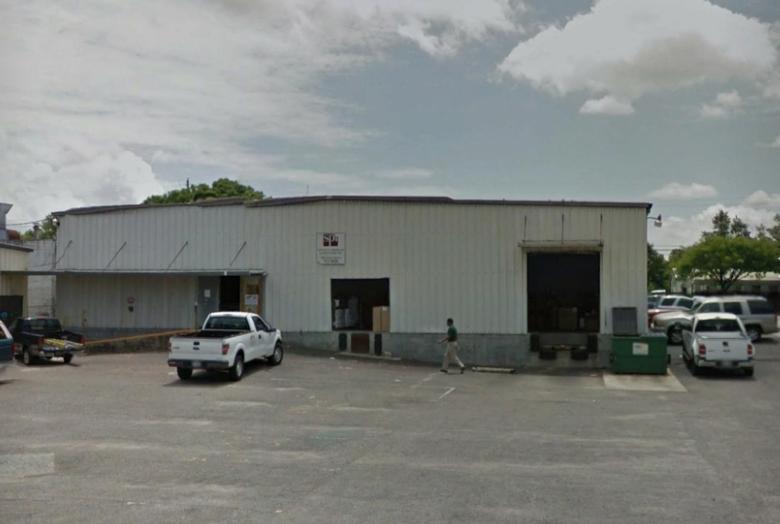
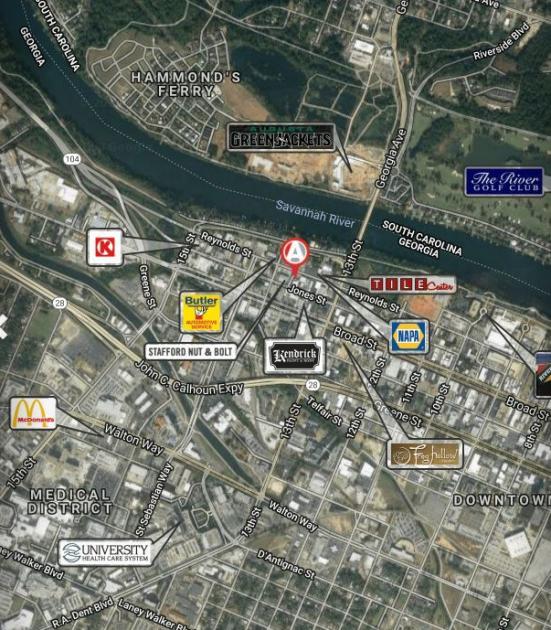
1345 Jones Street Augusta, GA 30901
1345 Jones Street Augusta, GA 30901
Details & Description
Property Highlights
- • 1 Dock Door
- • 1 Drive-In Door
- • Located in the Heart of Downtown Augusta
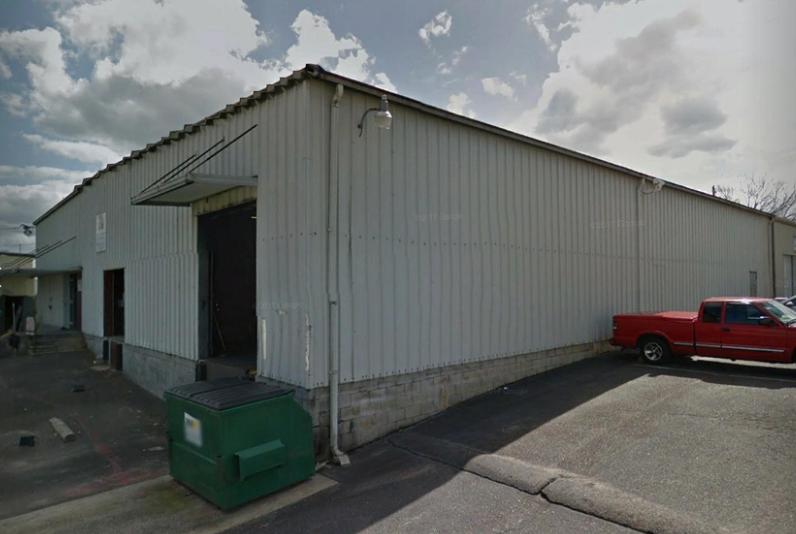
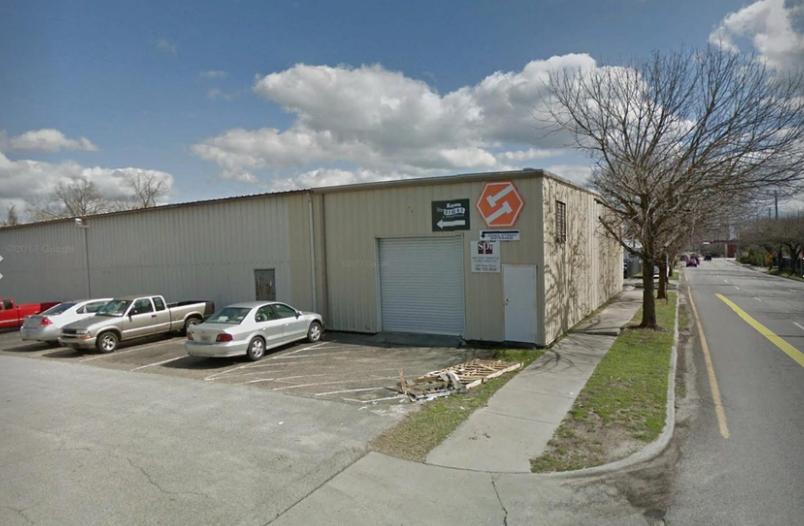
Additional Photos

Listing Agents

Scott A. Atkins
O: 706-951-6630
M: 706-650-1446
scott@atkinsrealty.com
O: 706-951-6630
M: 706-650-1446
scott@atkinsrealty.com
While we strive to provide the most accurate information, all listing information, and demographic data, is provided by third-parties. As such, MyEListing will not be responsible for the accuracy of the information. It is strongly recommended that you verify all information with the listing agent, and any relevant agencies, prior to making any decisions.


