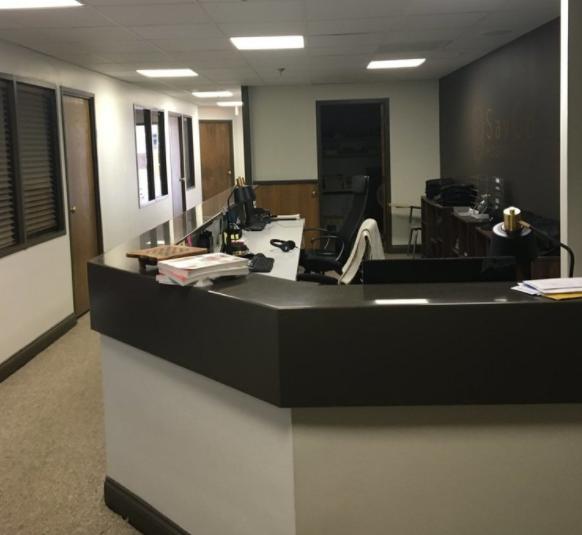
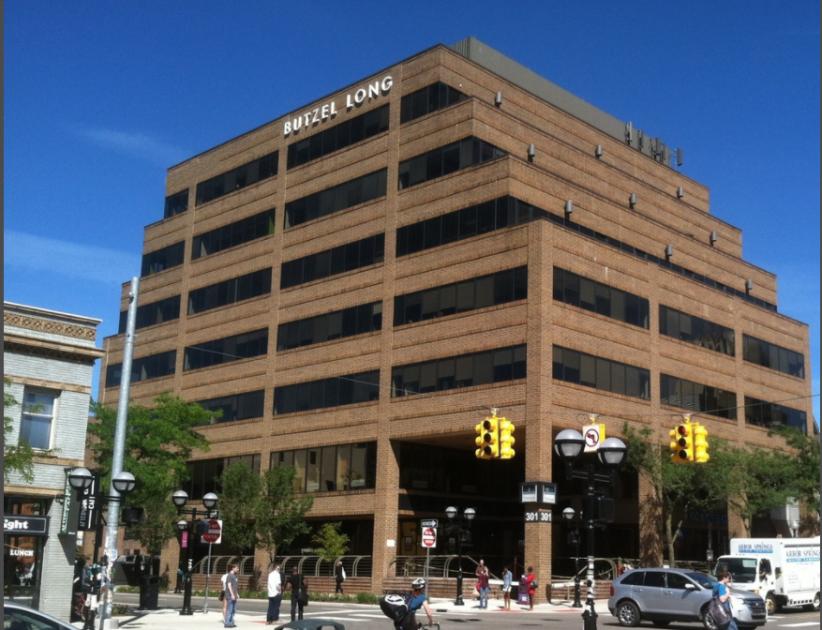
1-Mile | 3-Miles | 5-Miles | ||
---|---|---|---|---|
Total Population | 34,058 | 106,904 | 161,550 | |
Population Median Age | 28 | 34 | 35 | |
Population by Age | 0-9 Yrs | 688 (2%) | 7128 (6%) | 12974 (8%) |
10-19 Yrs | 7584 (22%) | 16804 (15%) | 23525 (14%) | |
20-29 Yrs | 18128 (53%) | 37397 (34%) | 46801 (28%) | |
30-39 Yrs | 2593 (7%) | 12649 (11%) | 19938 (12%) | |
40-49 Yrs | 1067 (3%) | 8093 (7%) | 15065 (9%) | |
50-59 Yrs | 1484 (4%) | 8504 (7%) | 15285 (9%) | |
60-69 Yrs | 1418 (4%) | 8638 (8%) | 14971 (9%) | |
70+ Yrs | 1096 (3%) | 7692 (7%) | 12991 (8%) | |
Median HH Income | $45,659 | $70,594 | $71,384 | |
Total Household Income | < 24K | 3782 (32%) | 9048 (21%) | 12831 (19%) |
25-49K | 2341 (20%) | 6505 (15%) | 10786 (16%) | |
50-74K | 1610 (14%) | 6232 (15%) | 9987 (15%) | |
75-99K | 1077 (9%) | 4901 (11%) | 7328 (11%) | |
100-199K | 1762 (15%) | 9726 (23%) | 15169 (23%) | |
200K+ | 907 (7%) | 5092 (12%) | 8452 (13%) | |
Highest Education Level | No Diploma | 380 | 1301 | 2956 |
Diploma or GED | 710 | 3461 | 7133 | |
Some College | 1139 | 5162 | 9998 | |
Assoc. Degree | 318 | 2070 | 4461 | |
Bachelors Degree | 4287 | 17870 | 27645 | |
Higher Degree | 4486 | 27175 | 42234 | |
Total Housing Units | 12,722 | 44,333 | 68,756 | |
--Owner-Occupied | 2,636 | 18,597 | 31,226 | |
--Renter-Occupied | 8,844 | 22,908 | 33,326 | |
Owner-Occupied Values | < 100K | 82 | 469 | 1595 |
100-199K | 118 | 1976 | 3983 | |
200-299K | 468 | 4370 | 7199 | |
300-399K | 741 | 4684 | 7027 | |
400-499K | 507 | 3034 | 4771 | |
500K+ | 719 | 4064 | 6651 | |
Total Working Age Population | 32,994 | 95,742 | 140,476 | |
In Work Force | 17,678 | 58,230 | 88,549 | |
Not In Work Force | 15,316 | 37,511 | 51,927 | |
Workforce Employed | 16,711 | 55,966 | 85,306 | |
Workforce Unemployed | 967 | 2,237 | 3,201 | |
Civlian Workforce | 17,678 | 58,203 | 88,507 | |
Military Workforce | 0 | 27 | 42 | |
Total Households | 11,479 | 41,504 | 64,552 | |
Family Households | 2,576 | 17,722 | 31,304 | |
Non-Family Households | 8,903 | 23,782 | 33,249 | |
Married Couple | 2,043 | 14,719 | 25,628 | |
Other Family | 534 | 3,003 | 5,675 | |
Married w/Child | 614 | 5,685 | 10,424 | |
Single Male w/Child | 61 | 376 | 690 | |
Single Female w/Child | 81 | 1,048 | 1,960 |
Population Change Last Two Decades - Plus Projection
2000 | % | 2010 | % | 2020 | % | 2030 | |
---|---|---|---|---|---|---|---|
Michigan | 9,938,444 | -1 | 9,883,640 | +1 | 10,023,423 | +4 | 10,424,510 |
Washtenaw County | 322,895 | +7 | 344,791 | +9 | 376,857 | +12 | 422,684 |
Total Working Age Population:
Total Households:
Total Working Age Population:
Total Households:
Total Working Age Population:
Total Households: