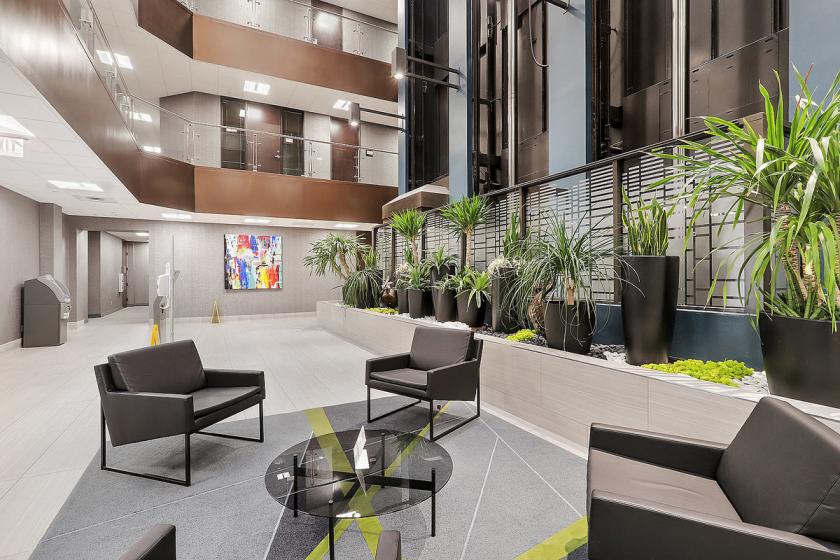
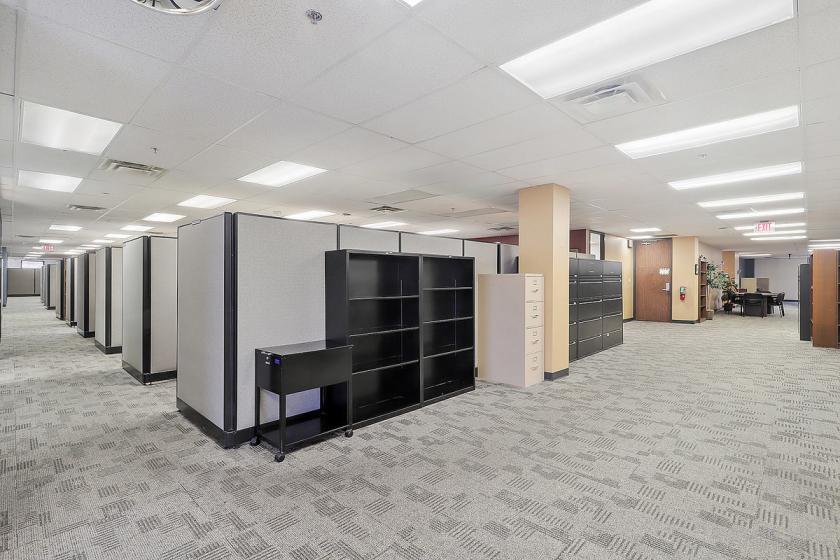
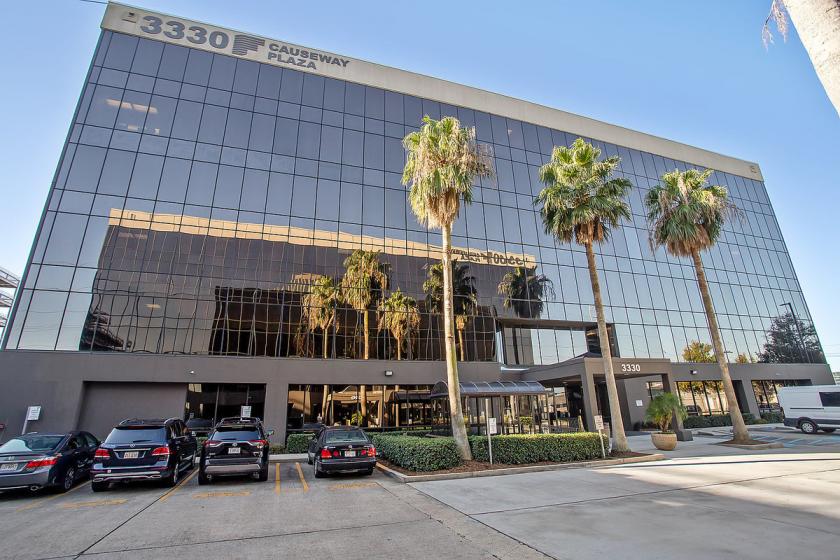
1-Mile | 3-Miles | 5-Miles | ||
---|---|---|---|---|
Total Population | 17,529 | 117,054 | 255,180 | |
Population Median Age | 41 | 41 | 41 | |
Population by Age | 0-9 Yrs | 2353 (13%) | 13982 (11%) | 30013 (11%) |
10-19 Yrs | 1253 (7%) | 10289 (8%) | 23579 (9%) | |
20-29 Yrs | 2544 (14%) | 15330 (13%) | 33873 (13%) | |
30-39 Yrs | 2837 (16%) | 17715 (15%) | 38456 (15%) | |
40-49 Yrs | 1687 (9%) | 14387 (12%) | 30820 (12%) | |
50-59 Yrs | 2119 (12%) | 15038 (12%) | 34714 (13%) | |
60-69 Yrs | 2148 (12%) | 14982 (12%) | 33318 (13%) | |
70+ Yrs | 2589 (14%) | 15333 (13%) | 30407 (11%) | |
Median HH Income | $58,177 | $62,356 | $59,622 | |
Total Household Income | < 24K | 1480 (19%) | 9628 (19%) | 22663 (21%) |
25-49K | 1643 (21%) | 10994 (21%) | 23004 (21%) | |
50-74K | 1315 (17%) | 8013 (16%) | 17392 (16%) | |
75-99K | 803 (10%) | 5856 (11%) | 12470 (11%) | |
100-199K | 1833 (24%) | 11596 (23%) | 23350 (21%) | |
200K+ | 426 (5%) | 3957 (7%) | 7948 (7%) | |
Highest Education Level | No Diploma | 997 | 6492 | 17928 |
Diploma or GED | 2905 | 22515 | 44896 | |
Some College | 2765 | 17372 | 39081 | |
Assoc. Degree | 630 | 4275 | 9310 | |
Bachelors Degree | 3597 | 22750 | 47055 | |
Higher Degree | 2269 | 13964 | 30375 | |
Total Housing Units | 7,915 | 54,611 | 118,909 | |
--Owner-Occupied | 3,807 | 28,585 | 62,183 | |
--Renter-Occupied | 3,693 | 21,459 | 44,644 | |
Owner-Occupied Values | < 100K | 280 | 1394 | 3581 |
100-199K | 473 | 5666 | 16334 | |
200-299K | 994 | 9910 | 19378 | |
300-399K | 1045 | 4891 | 9720 | |
400-499K | 573 | 2442 | 5181 | |
500K+ | 443 | 4282 | 7990 | |
Total Working Age Population | 14,398 | 96,572 | 210,732 | |
In Work Force | 9,111 | 64,370 | 139,232 | |
Not In Work Force | 5,286 | 32,202 | 71,500 | |
Workforce Employed | 8,789 | 61,902 | 132,885 | |
Workforce Unemployed | 303 | 2,162 | 5,829 | |
Civlian Workforce | 9,092 | 64,064 | 138,715 | |
Military Workforce | 19 | 307 | 517 | |
Total Households | 7,500 | 50,044 | 106,828 | |
Family Households | 4,466 | 29,319 | 60,932 | |
Non-Family Households | 3,034 | 20,726 | 45,895 | |
Married Couple | 3,200 | 21,352 | 43,257 | |
Other Family | 1,267 | 7,966 | 17,675 | |
Married w/Child | 1,056 | 7,799 | 15,572 | |
Single Male w/Child | 66 | 1,005 | 2,059 | |
Single Female w/Child | 567 | 3,014 | 6,564 |
Population Change Last Two Decades - Plus Projection
2000 | % | 2010 | % | 2020 | % | 2030 | |
---|---|---|---|---|---|---|---|
Louisiana | 4,468,976 | +1 | 4,533,372 | +1 | 4,588,310 | +5 | 4,813,420 |
Jefferson Parish | 455,466 | -5 | 432,552 | +4 | 450,200 | +1 | 454,670 |
Orleans Parish | 484,674 | -29 | 343,829 | -26 | 255,440 | 0 | 256,010 |
St. Charles Parish | 48,072 | +10 | 52,780 | +10 | 57,930 | +5 | 60,580 |
St. John the Baptist Parish | 43,044 | +7 | 45,924 | +25 | 57,410 | +13 | 65,110 |
Total Working Age Population:
Total Households:
Total Working Age Population:
Total Households:
Total Working Age Population:
Total Households: