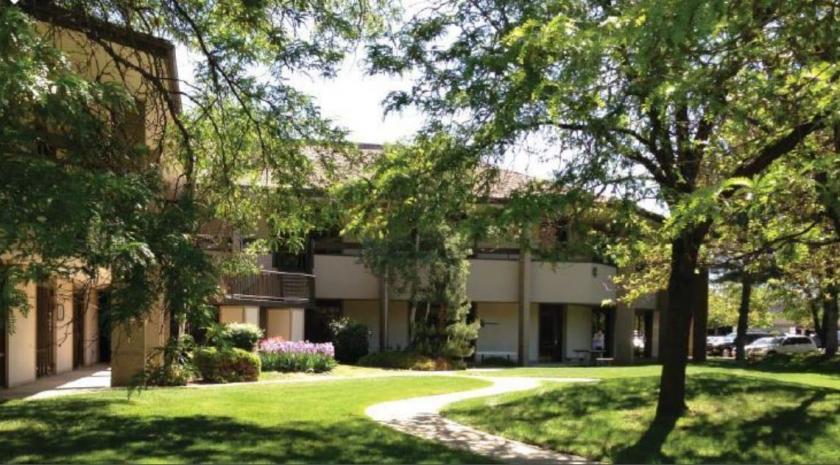
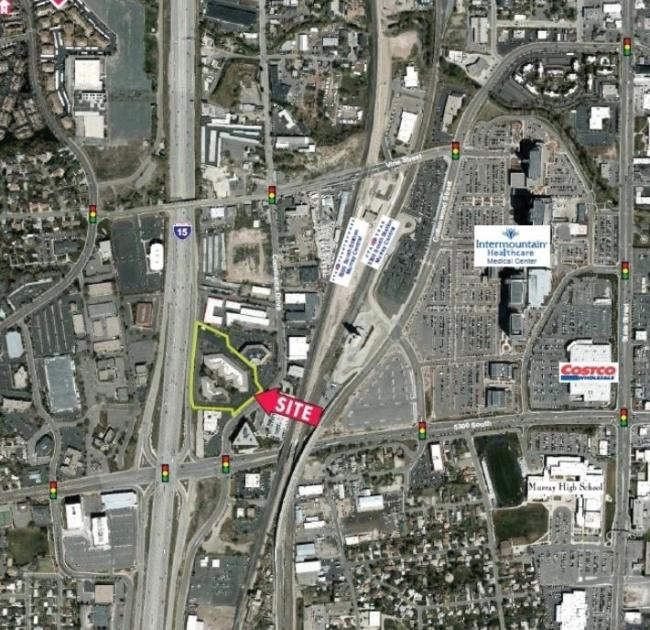
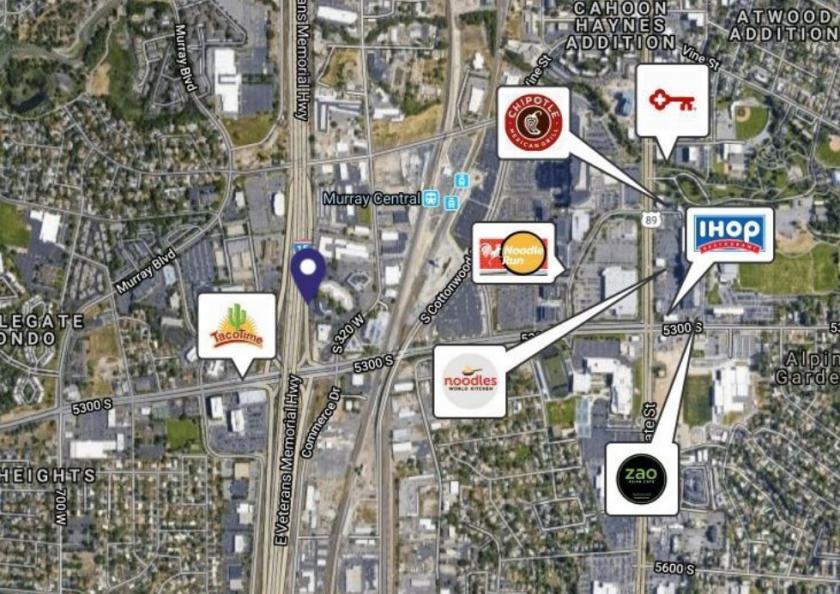
1-Mile | 3-Miles | 5-Miles | ||
---|---|---|---|---|
Total Population | 11,583 | 139,271 | 389,530 | |
Population Median Age | 36 | 36 | 36 | |
Population by Age | 0-9 Yrs | 1604 (13%) | 19189 (13%) | 55881 (14%) |
10-19 Yrs | 1298 (11%) | 15660 (11%) | 49528 (12%) | |
20-29 Yrs | 1928 (16%) | 24922 (17%) | 63986 (16%) | |
30-39 Yrs | 2199 (18%) | 22732 (16%) | 63341 (16%) | |
40-49 Yrs | 1271 (10%) | 17161 (12%) | 47046 (12%) | |
50-59 Yrs | 1251 (10%) | 13854 (9%) | 40134 (10%) | |
60-69 Yrs | 1228 (10%) | 13321 (9%) | 37135 (9%) | |
70+ Yrs | 805 (6%) | 12431 (8%) | 32479 (8%) | |
Median HH Income | $61,661 | $59,057 | $64,788 | |
Total Household Income | < 24K | 677 (15%) | 8294 (15%) | 20173 (14%) |
25-49K | 979 (22%) | 13619 (25%) | 31366 (22%) | |
50-74K | 970 (22%) | 11682 (21%) | 29693 (21%) | |
75-99K | 695 (16%) | 7942 (14%) | 20677 (14%) | |
100-199K | 932 (21%) | 10432 (19%) | 31088 (22%) | |
200K+ | 89 (2%) | 1785 (3%) | 6656 (4%) | |
Highest Education Level | No Diploma | 738 | 7990 | 25851 |
Diploma or GED | 2103 | 23327 | 63211 | |
Some College | 1905 | 25065 | 63282 | |
Assoc. Degree | 1043 | 8488 | 22770 | |
Bachelors Degree | 1410 | 19620 | 55066 | |
Higher Degree | 665 | 9535 | 26864 | |
Total Housing Units | 4,514 | 57,496 | 148,453 | |
--Owner-Occupied | 2,365 | 29,403 | 84,984 | |
--Renter-Occupied | 1,978 | 24,350 | 54,668 | |
Owner-Occupied Values | < 100K | 64 | 2508 | 4710 |
100-199K | 534 | 6045 | 17202 | |
200-299K | 944 | 10255 | 29772 | |
300-399K | 589 | 6798 | 18136 | |
400-499K | 171 | 2229 | 7446 | |
500K+ | 62 | 1567 | 7719 | |
Total Working Age Population | 9,251 | 110,976 | 303,220 | |
In Work Force | 6,904 | 79,761 | 216,210 | |
Not In Work Force | 2,347 | 31,215 | 87,010 | |
Workforce Employed | 6,733 | 76,357 | 207,731 | |
Workforce Unemployed | 171 | 3,348 | 8,275 | |
Civlian Workforce | 6,904 | 79,705 | 216,006 | |
Military Workforce | 0 | 57 | 204 | |
Total Households | 4,343 | 53,753 | 139,652 | |
Family Households | 2,679 | 32,491 | 91,535 | |
Non-Family Households | 1,664 | 21,263 | 48,117 | |
Married Couple | 1,901 | 23,460 | 67,056 | |
Other Family | 778 | 9,031 | 24,478 | |
Married w/Child | 775 | 9,813 | 29,265 | |
Single Male w/Child | 150 | 1,031 | 3,286 | |
Single Female w/Child | 189 | 3,036 | 8,512 |
Population Change Last Two Decades - Plus Projection
2000 | % | 2010 | % | 2020 | % | 2030 | |
---|---|---|---|---|---|---|---|
Utah | 2,233,169 | +24 | 2,763,885 | +20 | 3,325,425 | +17 | 3,889,310 |
Salt Lake County | 898,387 | +15 | 1,029,655 | +15 | 1,181,471 | +11 | 1,306,414 |
Total Working Age Population:
Total Households:
Total Working Age Population:
Total Households:
Total Working Age Population:
Total Households: