Industrial Properties
3076 Decker Lake Drive West Valley City, UT 84119
3076 Decker Lake Drive West Valley City, UT 84119
Details & Description
Property Highlights
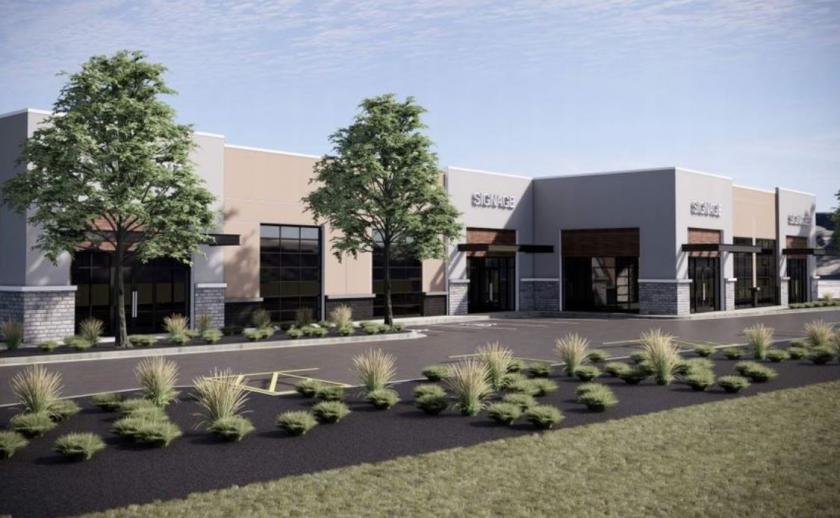
- • New Construction Aimed to Meet Tenant Requirements
- • Completion Scheduled for Early 2022
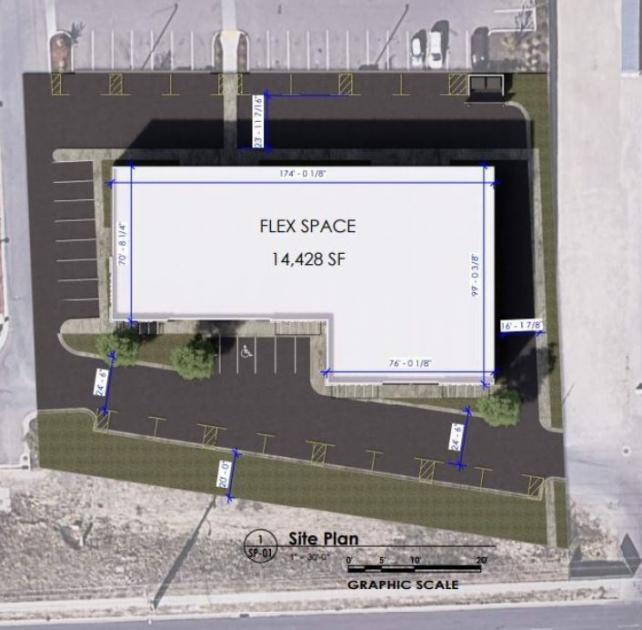
- • 20 Clear Height
- • Power 800 Amps, 277408V, 3-Phase
- • 28 Parking Stalls
Listing Agents

Cameron Rafati
O: 801-935-1014
crafati@me.com
O: 801-935-1014
crafati@me.com
While we strive to provide the most accurate information, all listing information, and demographic data, is provided by third-parties. As such, MyEListing will not be responsible for the accuracy of the information. It is strongly recommended that you verify all information with the listing agent, and any relevant agencies, prior to making any decisions.