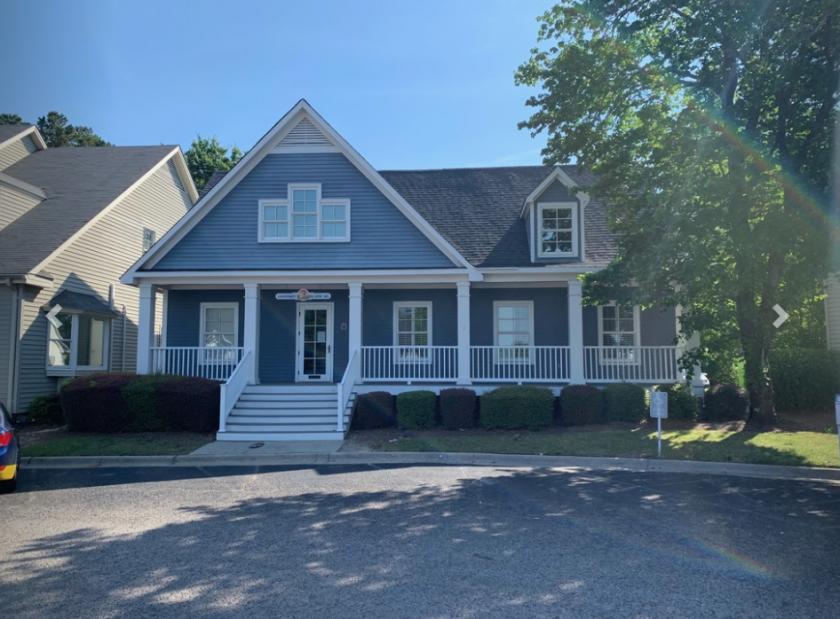
Office Space
3643 Walton Way Extension Augusta, GA 30909
3643 Walton Way Extension Augusta, GA 30909
Details & Description
Property Highlights
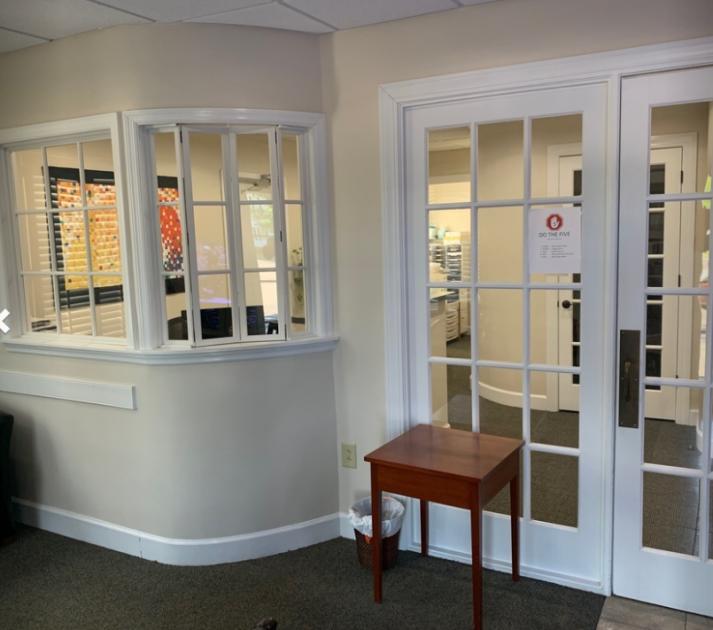
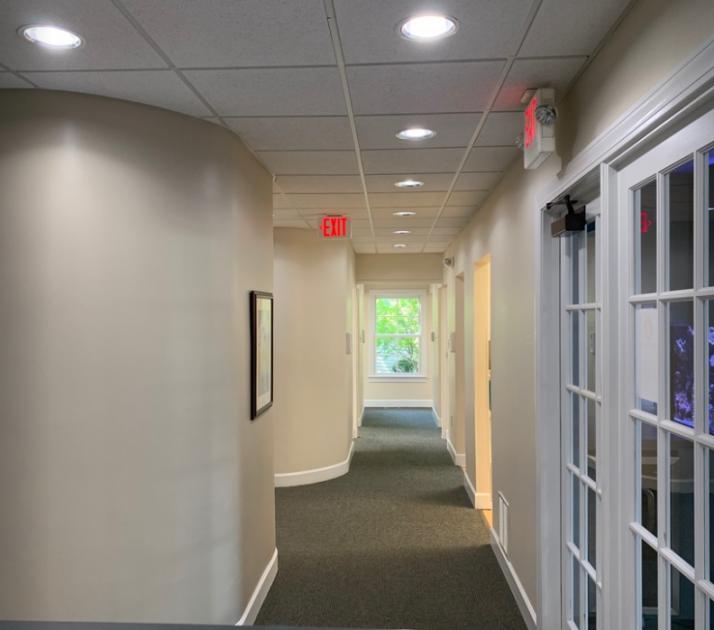
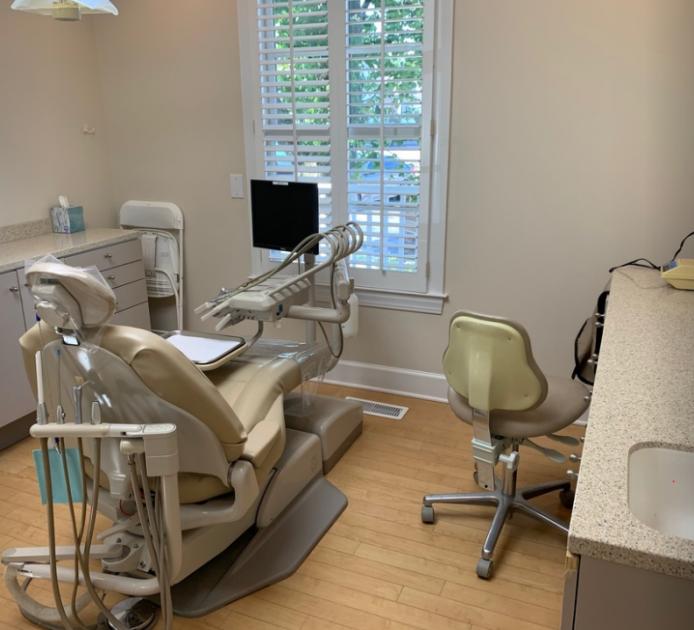
- • Turn Key Dental Office
- • Located in West Augusta
- • All Furniture and Equipment Included
- • 2,951 sq. ft. Two Story Office
Additional Photos

Listing Agents

Scott A. Atkins
O: 706-951-6630
M: 706-650-1446
scott@atkinsrealty.com
O: 706-951-6630
M: 706-650-1446
scott@atkinsrealty.com
While we strive to provide the most accurate information, all listing information, and demographic data, is provided by third-parties. As such, MyEListing will not be responsible for the accuracy of the information. It is strongly recommended that you verify all information with the listing agent, and any relevant agencies, prior to making any decisions.


