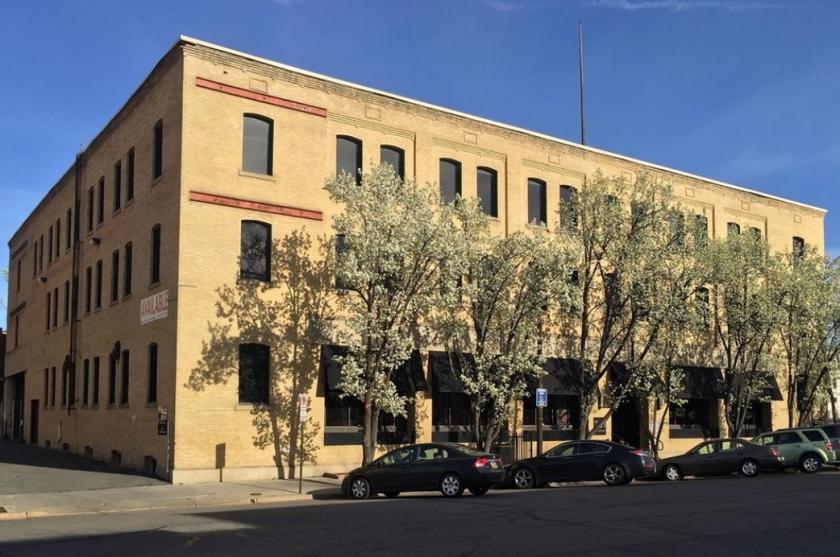
Office Space
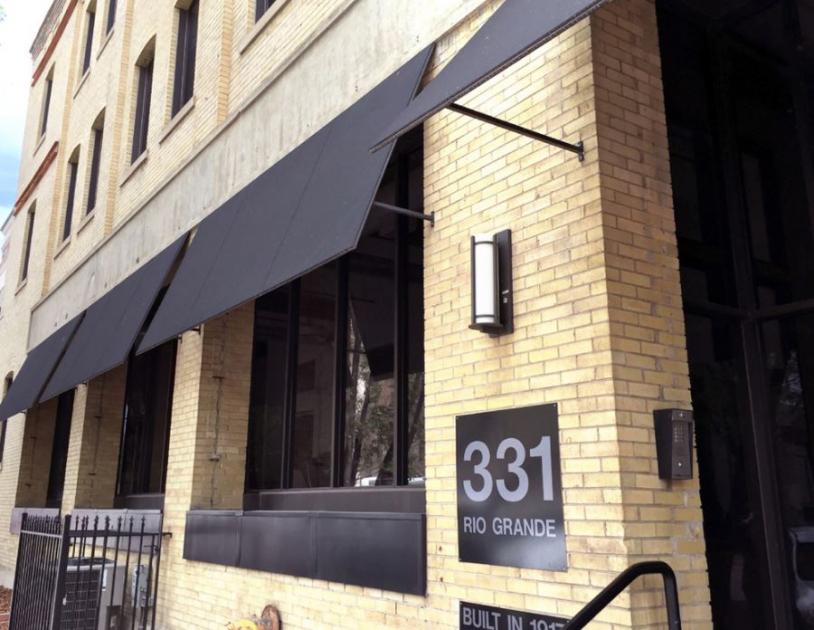
331 South Rio Grande Street Salt Lake City, UT 84101
331 South Rio Grande Street Salt Lake City, UT 84101
Details & Description
Property Highlights
- • Located Next to all Major Freeways
- • Next to Homewood Suites by Hilton
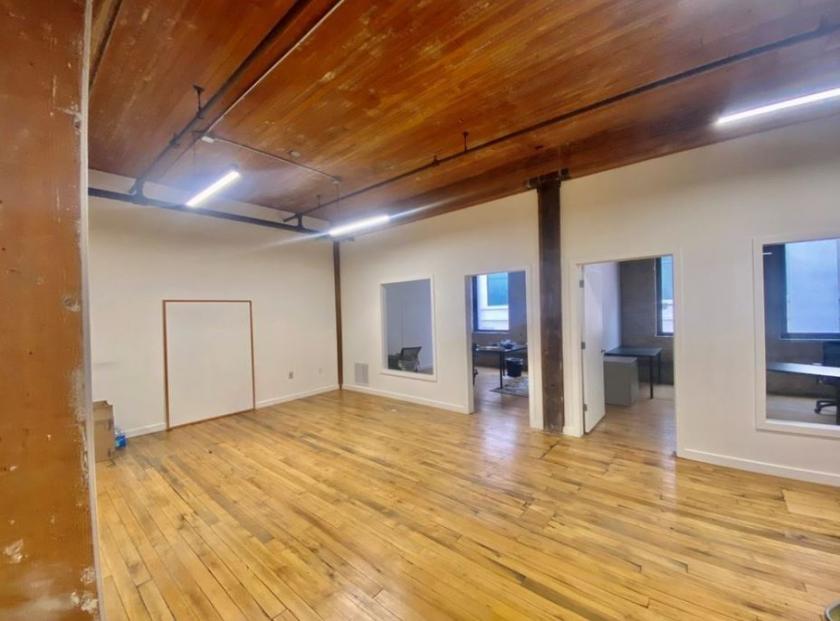
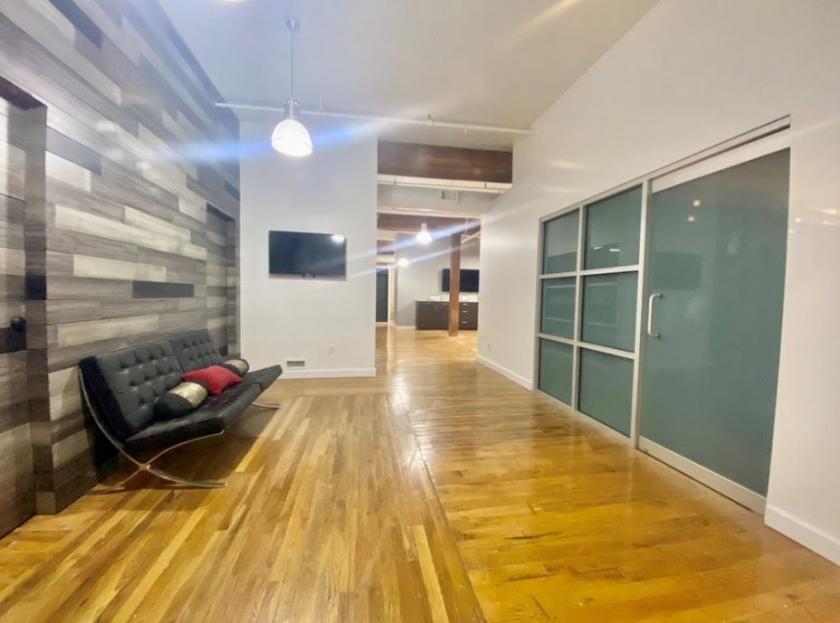
- • Suites Offer Open Floor Plans Tall Ceilings
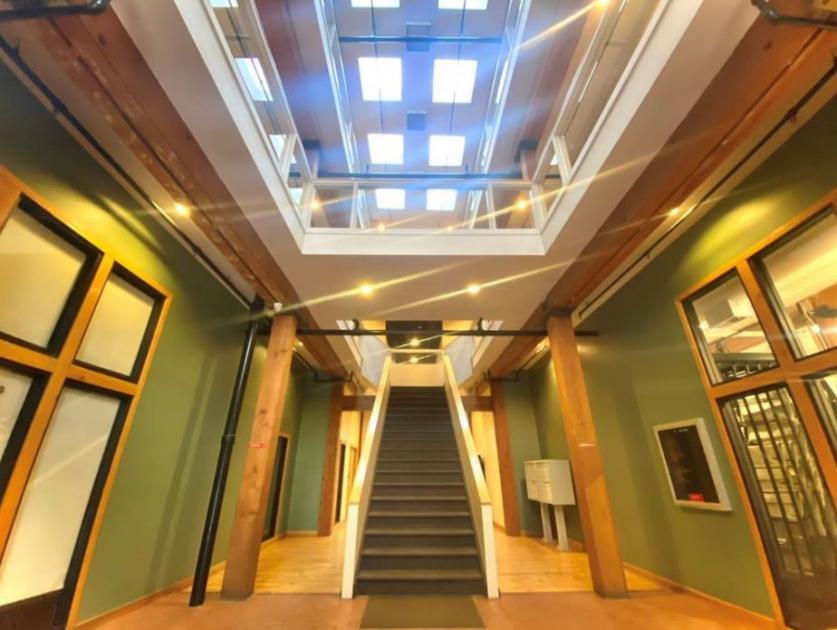
- • Lots of Natural Light in Suites Common Areas
- • Exposed Brick and Natural Hardwood Floors
- • ADA Access with Elevator
Additional Photos
Listing Agents

Christian Priskos
O: 801-573-8500
christian@iproperties.com
O: 801-573-8500
christian@iproperties.com
While we strive to provide the most accurate information, all listing information, and demographic data, is provided by third-parties. As such, MyEListing will not be responsible for the accuracy of the information. It is strongly recommended that you verify all information with the listing agent, and any relevant agencies, prior to making any decisions.


