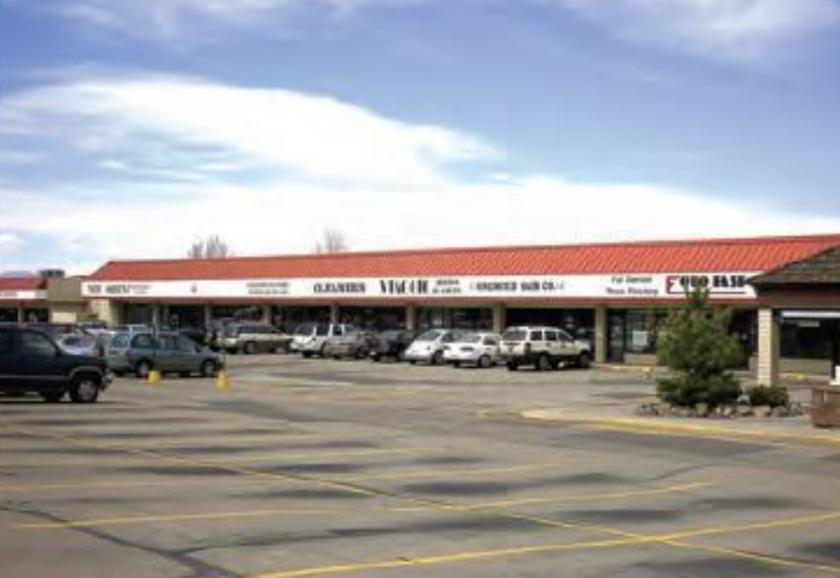
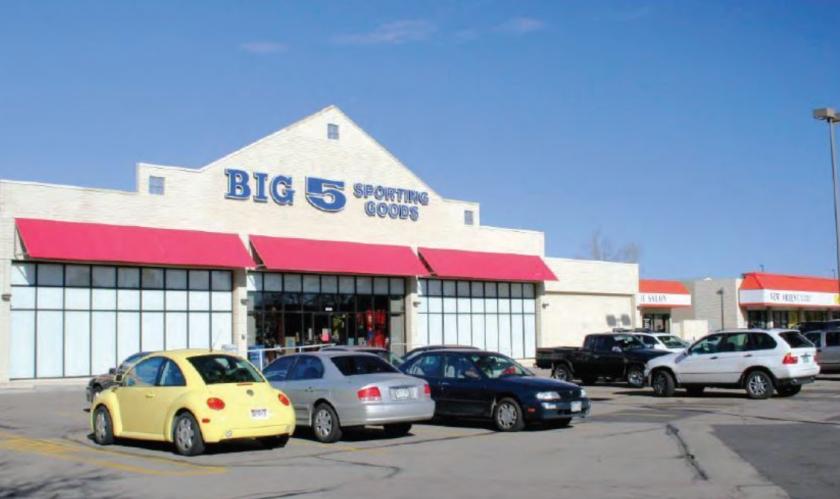
1-Mile | 3-Miles | 5-Miles | ||
---|---|---|---|---|
Total Population | 18,280 | 174,508 | 447,268 | |
Population Median Age | 39 | 39 | 37 | |
Population by Age | 0-9 Yrs | 2075 (11%) | 21181 (12%) | 55295 (12%) |
10-19 Yrs | 1437 (7%) | 17015 (9%) | 50389 (11%) | |
20-29 Yrs | 3495 (19%) | 29527 (16%) | 74803 (16%) | |
30-39 Yrs | 2616 (14%) | 27940 (16%) | 72798 (16%) | |
40-49 Yrs | 2334 (12%) | 23114 (13%) | 59570 (13%) | |
50-59 Yrs | 2522 (13%) | 18875 (10%) | 49885 (11%) | |
60-69 Yrs | 1936 (10%) | 17886 (10%) | 44621 (9%) | |
70+ Yrs | 1865 (10%) | 18970 (10%) | 39908 (8%) | |
Median HH Income | $61,972 | $58,260 | $63,753 | |
Total Household Income | < 24K | 1295 (15%) | 13193 (17%) | 28554 (15%) |
25-49K | 2153 (25%) | 19066 (24%) | 41990 (22%) | |
50-74K | 1426 (16%) | 15577 (20%) | 35502 (19%) | |
75-99K | 1130 (13%) | 10686 (13%) | 24984 (13%) | |
100-199K | 1960 (23%) | 14490 (18%) | 37411 (20%) | |
200K+ | 507 (5%) | 3574 (4%) | 14790 (8%) | |
Highest Education Level | No Diploma | 756 | 10630 | 29687 |
Diploma or GED | 2355 | 25759 | 63587 | |
Some College | 2920 | 25527 | 60052 | |
Assoc. Degree | 1015 | 10242 | 23402 | |
Bachelors Degree | 4233 | 33213 | 82329 | |
Higher Degree | 2202 | 19254 | 51307 | |
Total Housing Units | 8,956 | 81,374 | 194,842 | |
--Owner-Occupied | 3,693 | 36,056 | 91,321 | |
--Renter-Occupied | 4,778 | 40,529 | 91,910 | |
Owner-Occupied Values | < 100K | 169 | 2069 | 3904 |
100-199K | 694 | 7618 | 13750 | |
200-299K | 985 | 10074 | 23018 | |
300-399K | 897 | 7145 | 18343 | |
400-499K | 482 | 4718 | 9981 | |
500K+ | 466 | 4432 | 22325 | |
Total Working Age Population | 15,296 | 142,539 | 360,993 | |
In Work Force | 11,491 | 100,746 | 256,322 | |
Not In Work Force | 3,806 | 41,793 | 104,671 | |
Workforce Employed | 10,974 | 95,997 | 244,068 | |
Workforce Unemployed | 486 | 4,471 | 11,647 | |
Civlian Workforce | 11,460 | 100,468 | 255,715 | |
Military Workforce | 31 | 278 | 606 | |
Total Households | 8,472 | 76,585 | 183,231 | |
Family Households | 3,953 | 38,652 | 99,907 | |
Non-Family Households | 4,519 | 37,933 | 83,324 | |
Married Couple | 2,767 | 25,894 | 69,925 | |
Other Family | 1,186 | 12,758 | 29,982 | |
Married w/Child | 1,096 | 10,623 | 30,349 | |
Single Male w/Child | 122 | 1,601 | 3,986 | |
Single Female w/Child | 462 | 4,906 | 10,866 |
Population Change Last Two Decades - Plus Projection
2000 | % | 2010 | % | 2020 | % | 2030 | |
---|---|---|---|---|---|---|---|
Colorado | 4,301,261 | +17 | 5,029,196 | +16 | 5,838,181 | +15 | 6,733,658 |
Adams County | 363,857 | +21 | 441,603 | +20 | 530,680 | +21 | 642,318 |
Arapahoe County | 487,967 | +17 | 572,003 | +16 | 662,304 | +13 | 750,773 |
Denver County | 554,636 | +8 | 600,158 | +23 | 738,611 | +12 | 827,681 |
Total Working Age Population:
Total Households:
Total Working Age Population:
Total Households:
Total Working Age Population:
Total Households: