Commercial Land
7550 Garners Ferry Road Columbia, SC 29209
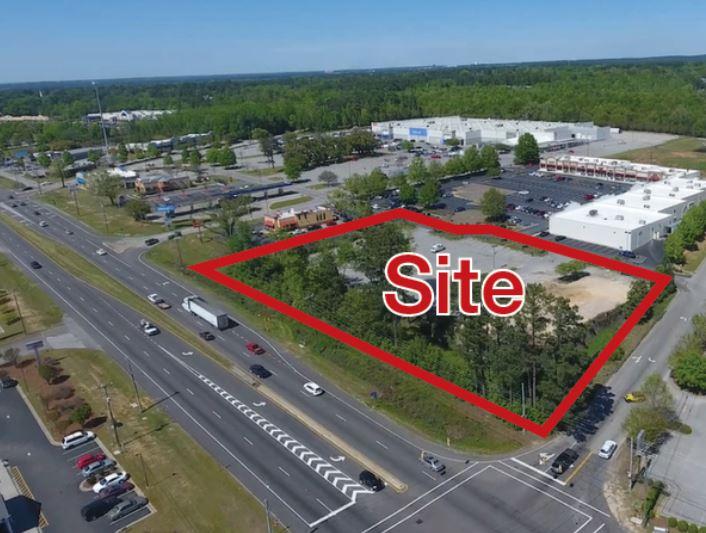
7550 Garners Ferry Road Columbia, SC 29209
Details & Description
Property Highlights
- • Zoning D-1 Development District, City of Columbia
- • Parking lot present and paved
- • Traffic Counts - 33,400 VPD
Listing Agents

Peyton Bryant
O: 803-744-9876
pbryant@trinity-partners.com
O: 803-744-9876
pbryant@trinity-partners.com

Ryan Causey
O: 803-744-9836
rcausey@trinity-partners.com
O: 803-744-9836
rcausey@trinity-partners.com
While we strive to provide the most accurate information, all listing information, and demographic data, is provided by third-parties. As such, MyEListing will not be responsible for the accuracy of the information. It is strongly recommended that you verify all information with the listing agent, and any relevant agencies, prior to making any decisions.


