Multifamily Housing
16464 Boones Ferry Road Lake Oswego, OR 97035
16464 Boones Ferry Road Lake Oswego, OR 97035
Details & Description
Property Highlights
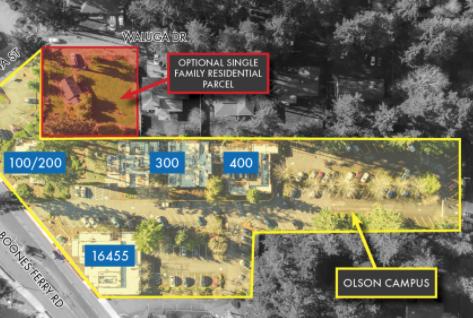
- • Building Sq. Ft. 20,651 SF
- • Campus Land Size 2.87 acres 124,962 SF
- • SFR Land Size 0.37 acres 16,333 SF
- • Total Land Area 3.24 acres 141,295 SF
- • Year Built 1969
- • Zoning OC GC R-8.5 R-7.5
Additional Photos


Listing Agents

David Chatfield
O: 503-225-8487
M: 503-440-2178
davidc@norris-stevens.com
O: 503-225-8487
M: 503-440-2178
davidc@norris-stevens.com
While we strive to provide the most accurate information, all listing information, and demographic data, is provided by third-parties. As such, MyEListing will not be responsible for the accuracy of the information. It is strongly recommended that you verify all information with the listing agent, and any relevant agencies, prior to making any decisions.