Office Space
20800 Southfield Road Southfield, MI 48075
20800 Southfield Road Southfield, MI 48075
Details & Description
Property Highlights
• North Bldg. roof installed 2013 warranted until 2028 South Bldg. roof installed 2009 warranted until 2026
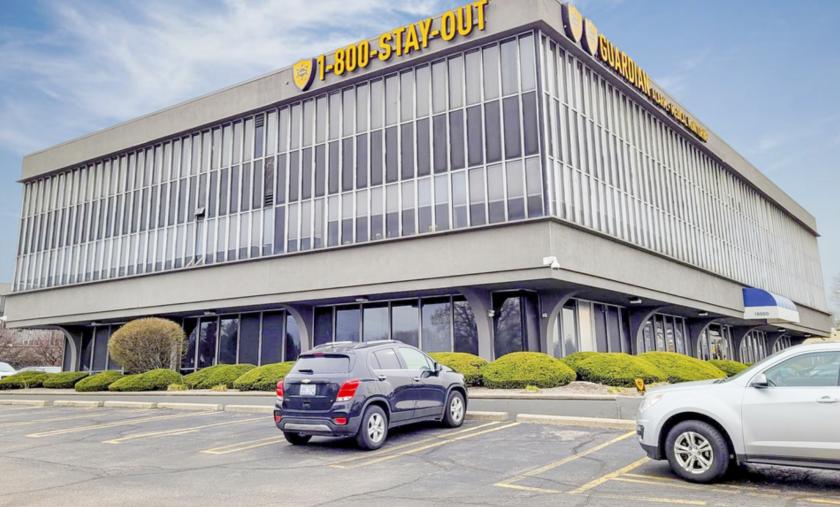
• Highly accessiblevisible centrally-located complex with prominent signage from Southfield Freeway M-39
Listing Agents

Dan Verderbar
O: 248-324-2000
dan.verderbar@freg.com
O: 248-324-2000
dan.verderbar@freg.com
While we strive to provide the most accurate information, all listing information, and demographic data, is provided by third-parties. As such, MyEListing will not be responsible for the accuracy of the information. It is strongly recommended that you verify all information with the listing agent, and any relevant agencies, prior to making any decisions.