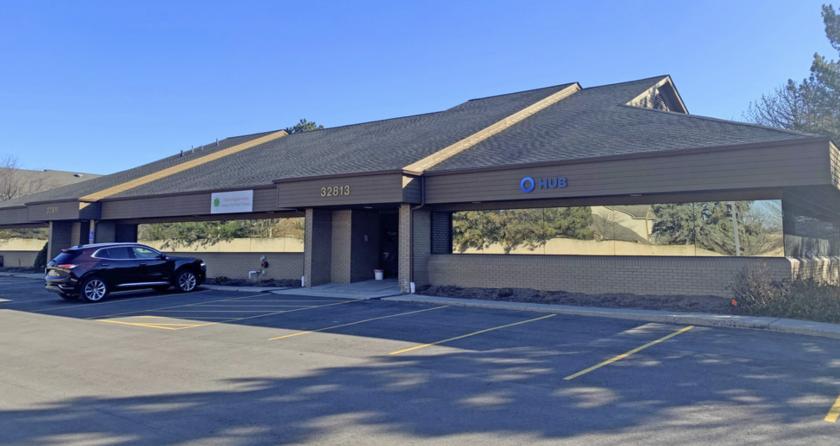
Office Space
32811 Middlebelt Road Farmington Hills, MI 48334
32811 Middlebelt Road Farmington Hills, MI 48334
Details & Description
Property Highlights
- • Fully leased to 9 national and local tenants
- • Staggered lease expirations through 2023
- • Strong historical occupancy
- • Easy access to M-10, M-24 and I-696
- • Excellent owner-user investment opportunity
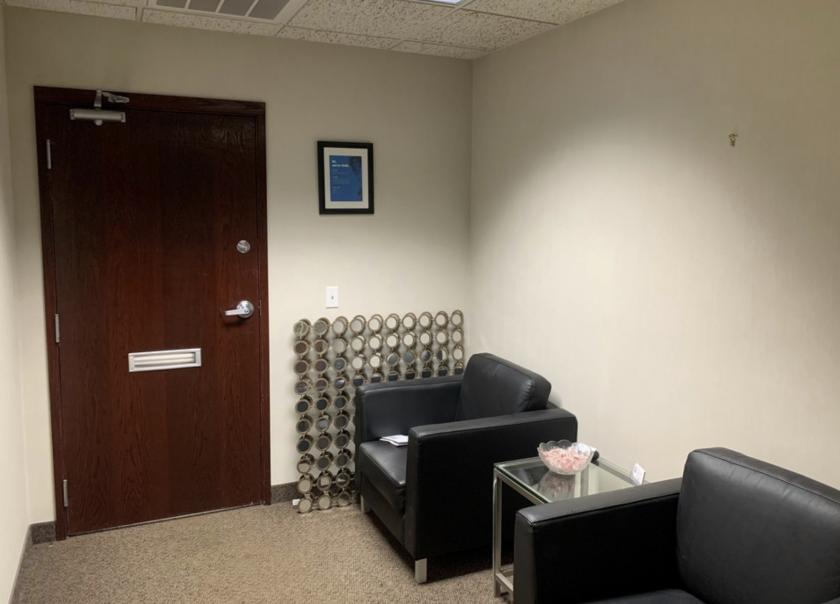
- • Owner-user suite available on 1st floor 2,500 SF
Listing Agents

Andrew Bower
O: 248-324-2000
M: 248-848-4193
Andrew.bower@freg.com
O: 248-324-2000
M: 248-848-4193
Andrew.bower@freg.com
While we strive to provide the most accurate information, all listing information, and demographic data, is provided by third-parties. As such, MyEListing will not be responsible for the accuracy of the information. It is strongly recommended that you verify all information with the listing agent, and any relevant agencies, prior to making any decisions.