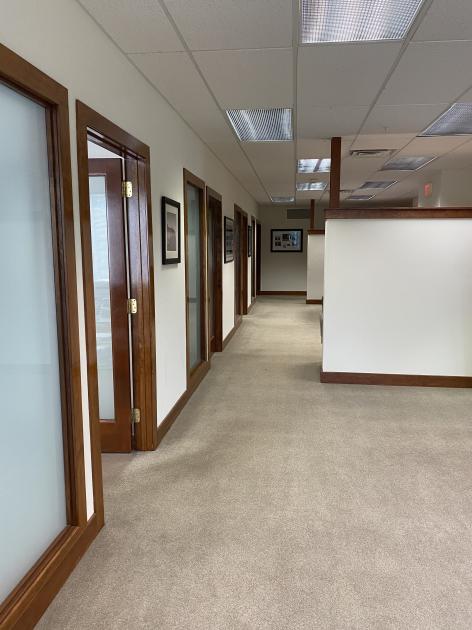
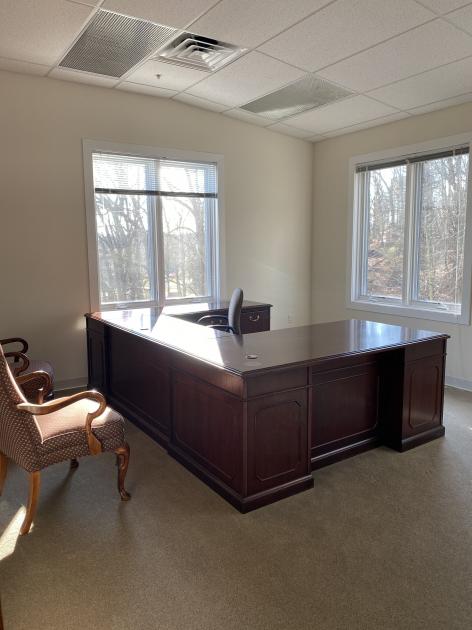
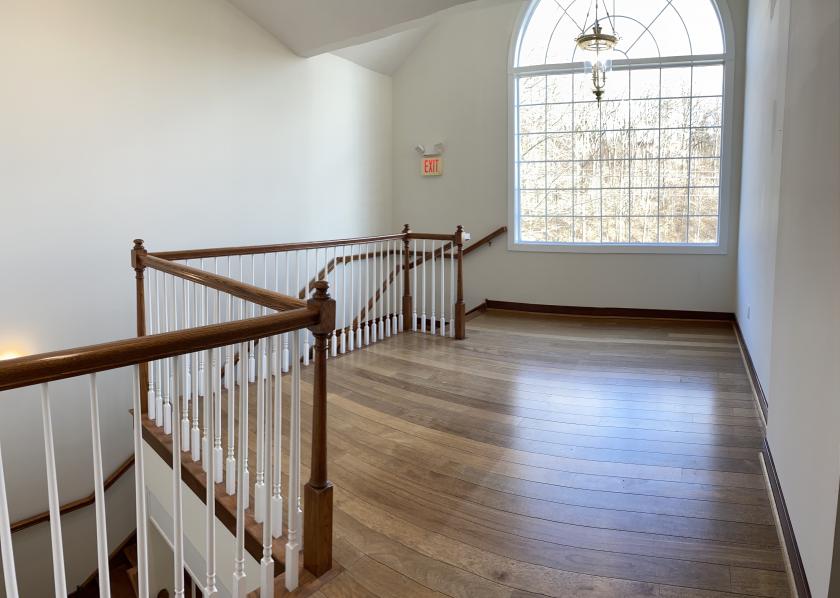
1-Mile | 3-Miles | 5-Miles | ||
---|---|---|---|---|
Total Population | 6,971 | 38,355 | 90,558 | |
Population Median Age | 38 | 39 | 39 | |
Population by Age | 0-9 Yrs | 853 (12%) | 4814 (12%) | 11056 (12%) |
10-19 Yrs | 743 (10%) | 5186 (13%) | 12372 (13%) | |
20-29 Yrs | 1001 (14%) | 3924 (10%) | 9062 (10%) | |
30-39 Yrs | 1178 (16%) | 5605 (14%) | 11978 (13%) | |
40-49 Yrs | 737 (10%) | 5043 (13%) | 12486 (13%) | |
50-59 Yrs | 1042 (14%) | 5883 (15%) | 13919 (15%) | |
60-69 Yrs | 891 (12%) | 4693 (12%) | 10927 (12%) | |
70+ Yrs | 526 (7%) | 3207 (8%) | 8758 (9%) | |
Median HH Income | $102,751 | $114,505 | $116,916 | |
Total Household Income | < 24K | 249 (9%) | 975 (6%) | 2399 (7%) |
25-49K | 270 (9%) | 1681 (11%) | 3713 (11%) | |
50-74K | 368 (13%) | 1664 (11%) | 4096 (12%) | |
75-99K | 435 (15%) | 1873 (12%) | 4051 (12%) | |
100-199K | 1017 (37%) | 5353 (36%) | 11971 (35%) | |
200K+ | 407 (14%) | 2949 (20%) | 7479 (22%) | |
Highest Education Level | No Diploma | 193 | 902 | 1962 |
Diploma or GED | 712 | 3482 | 9162 | |
Some College | 695 | 3394 | 7771 | |
Assoc. Degree | 383 | 2009 | 4418 | |
Bachelors Degree | 1822 | 10342 | 23813 | |
Higher Degree | 1169 | 6467 | 15625 | |
Total Housing Units | 2,903 | 15,168 | 35,112 | |
--Owner-Occupied | 1,358 | 10,646 | 25,997 | |
--Renter-Occupied | 1,388 | 3,849 | 7,713 | |
Owner-Occupied Values | < 100K | 14 | 197 | 519 |
100-199K | 21 | 391 | 1144 | |
200-299K | 342 | 2927 | 5719 | |
300-399K | 439 | 2755 | 5848 | |
400-499K | 291 | 2329 | 5917 | |
500K+ | 250 | 2049 | 6851 | |
Total Working Age Population | 5,565 | 30,217 | 71,873 | |
In Work Force | 3,932 | 22,129 | 51,136 | |
Not In Work Force | 1,633 | 8,088 | 20,738 | |
Workforce Employed | 3,855 | 21,399 | 49,363 | |
Workforce Unemployed | 78 | 702 | 1,721 | |
Civlian Workforce | 3,932 | 22,100 | 51,084 | |
Military Workforce | 0 | 28 | 52 | |
Total Households | 2,745 | 14,495 | 33,710 | |
Family Households | 1,862 | 10,458 | 24,654 | |
Non-Family Households | 883 | 4,037 | 9,056 | |
Married Couple | 1,603 | 8,697 | 20,962 | |
Other Family | 259 | 1,761 | 3,691 | |
Married w/Child | 742 | 4,119 | 9,803 | |
Single Male w/Child | 39 | 336 | 535 | |
Single Female w/Child | 91 | 571 | 1,183 |
Population Change Last Two Decades - Plus Projection
2000 | % | 2010 | % | 2020 | % | 2030 | |
---|---|---|---|---|---|---|---|
Pennsylvania | 12,281,054 | +3 | 12,702,379 | +4 | 13,230,170 | +4 | 13,759,594 |
Chester County | 433,501 | +15 | 498,886 | +7 | 533,837 | +7 | 573,576 |
Delaware County | 550,864 | +1 | 558,979 | +5 | 588,436 | +6 | 622,307 |
Montgomery County | 750,097 | +7 | 799,874 | +5 | 838,883 | +6 | 891,868 |
Total Working Age Population:
Total Households:
Total Working Age Population:
Total Households:
Total Working Age Population:
Total Households: