Commercial Land
1258 West Baltimore Pike Media, PA 19063
1258 West Baltimore Pike Media, PA 19063
Details & Description
Property Highlights
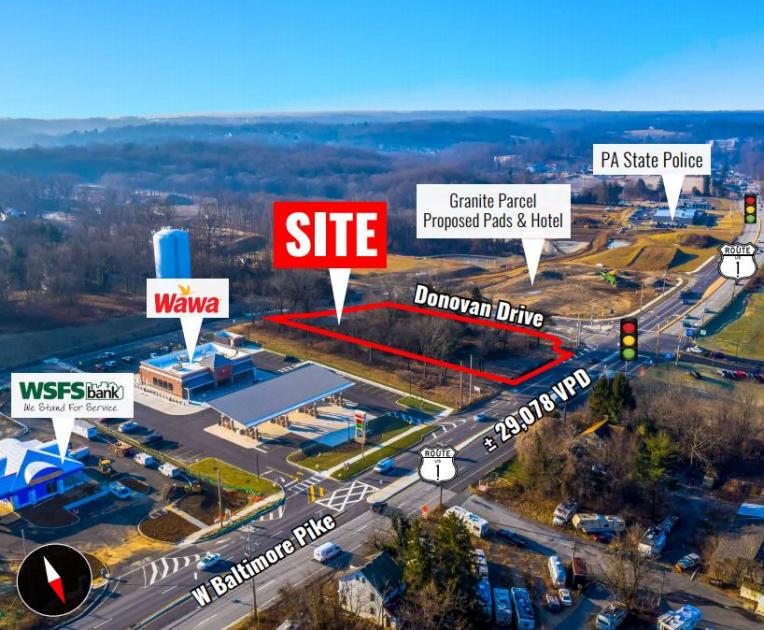
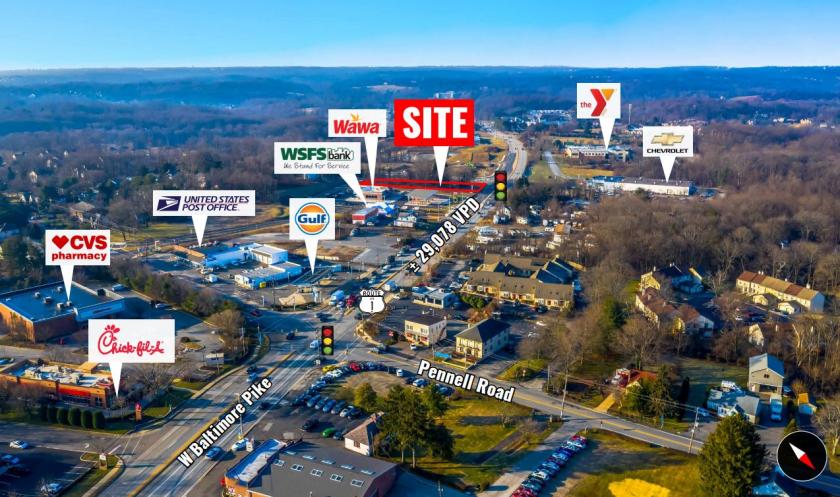
• Located near Riddle Memorial Hospital, The Promenade at Granite Run Major Retailers
• Site is located on heavily-traveled W Baltimore Pike Route 1 with over 29,078 VPD
Additional Photos


Listing Agents

Ryan McMahon
O: 610-299-5144
M: 610-359-1100
rmcmahon@zmcre.com
O: 610-299-5144
M: 610-359-1100
rmcmahon@zmcre.com
While we strive to provide the most accurate information, all listing information, and demographic data, is provided by third-parties. As such, MyEListing will not be responsible for the accuracy of the information. It is strongly recommended that you verify all information with the listing agent, and any relevant agencies, prior to making any decisions.


