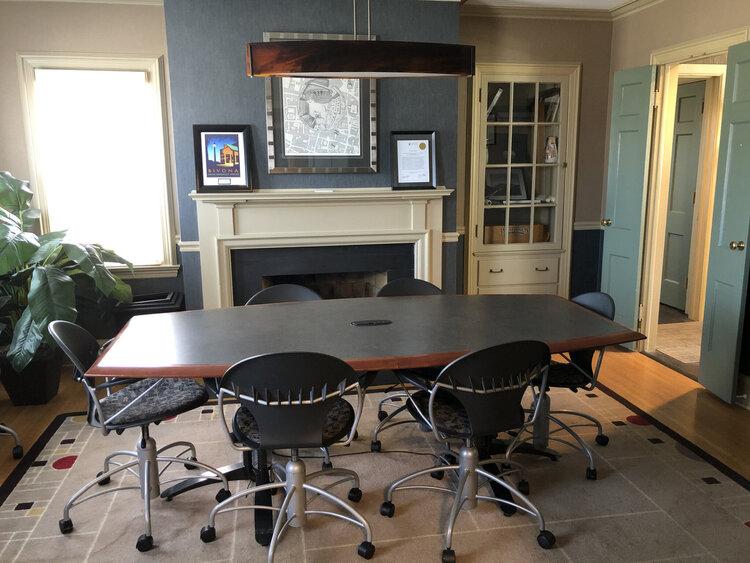
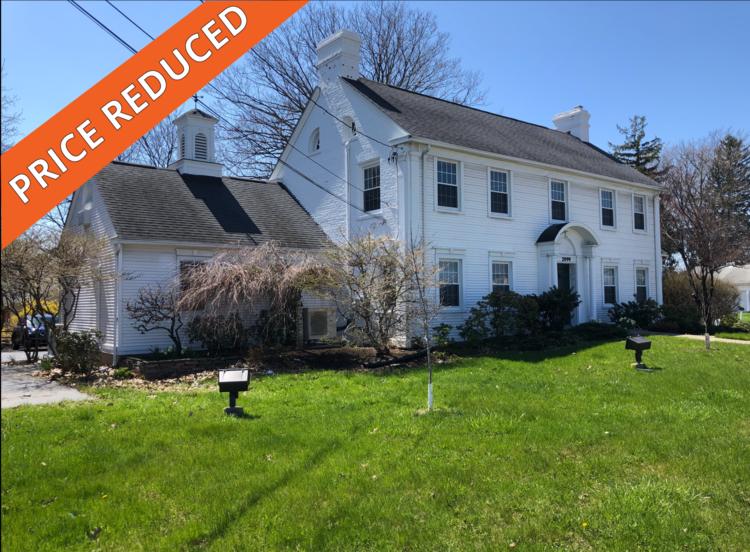
1-Mile | 3-Miles | 5-Miles | ||
---|---|---|---|---|
Total Population | 9,639 | 85,755 | 225,735 | |
Population Median Age | 43 | 40 | 39 | |
Population by Age | 0-9 Yrs | 928 (9%) | 9695 (11%) | 29051 (12%) |
10-19 Yrs | 974 (10%) | 10504 (12%) | 28132 (12%) | |
20-29 Yrs | 1324 (13%) | 11570 (13%) | 30643 (13%) | |
30-39 Yrs | 1158 (12%) | 11639 (13%) | 29499 (13%) | |
40-49 Yrs | 1032 (10%) | 9811 (11%) | 26858 (11%) | |
50-59 Yrs | 1400 (14%) | 12020 (14%) | 30875 (13%) | |
60-69 Yrs | 1289 (13%) | 10315 (12%) | 26936 (11%) | |
70+ Yrs | 1534 (15%) | 10201 (11%) | 23742 (10%) | |
Median HH Income | $61,197 | $52,507 | $47,041 | |
Total Household Income | < 24K | 710 (17%) | 7539 (21%) | 25197 (27%) |
25-49K | 939 (22%) | 9542 (26%) | 23640 (25%) | |
50-74K | 968 (23%) | 6800 (19%) | 16045 (17%) | |
75-99K | 642 (15%) | 4882 (13%) | 10764 (11%) | |
100-199K | 808 (19%) | 5952 (16%) | 14729 (15%) | |
200K+ | 66 (1%) | 928 (2%) | 2304 (2%) | |
Highest Education Level | No Diploma | 801 | 7089 | 23135 |
Diploma or GED | 2459 | 19179 | 46076 | |
Some College | 1380 | 11386 | 28608 | |
Assoc. Degree | 918 | 8288 | 19774 | |
Bachelors Degree | 1054 | 9539 | 24080 | |
Higher Degree | 609 | 5009 | 13115 | |
Total Housing Units | 4,288 | 38,169 | 101,909 | |
--Owner-Occupied | 2,774 | 21,792 | 53,071 | |
--Renter-Occupied | 1,360 | 13,851 | 39,608 | |
Owner-Occupied Values | < 100K | 875 | 8505 | 19061 |
100-199K | 1821 | 11352 | 28221 | |
200-299K | 49 | 1444 | 4029 | |
300-399K | 8 | 162 | 832 | |
400-499K | 4 | 116 | 394 | |
500K+ | 17 | 212 | 534 | |
Total Working Age Population | 8,115 | 69,446 | 178,756 | |
In Work Force | 5,347 | 44,592 | 111,966 | |
Not In Work Force | 2,768 | 24,854 | 66,789 | |
Workforce Employed | 5,078 | 42,081 | 103,784 | |
Workforce Unemployed | 265 | 2,496 | 8,168 | |
Civlian Workforce | 5,342 | 44,577 | 111,951 | |
Military Workforce | 5 | 15 | 15 | |
Total Households | 4,133 | 35,643 | 92,679 | |
Family Households | 2,377 | 21,147 | 55,402 | |
Non-Family Households | 1,757 | 14,496 | 37,278 | |
Married Couple | 1,570 | 13,204 | 32,420 | |
Other Family | 807 | 7,943 | 22,981 | |
Married w/Child | 475 | 4,438 | 11,479 | |
Single Male w/Child | 80 | 824 | 2,195 | |
Single Female w/Child | 284 | 3,485 | 11,014 |
Population Change Last Two Decades - Plus Projection
2000 | % | 2010 | % | 2020 | % | 2030 | |
---|---|---|---|---|---|---|---|
New York | 18,976,457 | +2 | 19,378,102 | +4 | 20,146,131 | +2 | 20,604,030 |
Monroe County | 735,343 | +1 | 744,344 | +1 | 754,529 | +1 | 758,536 |
Total Working Age Population:
Total Households:
Total Working Age Population:
Total Households:
Total Working Age Population:
Total Households: