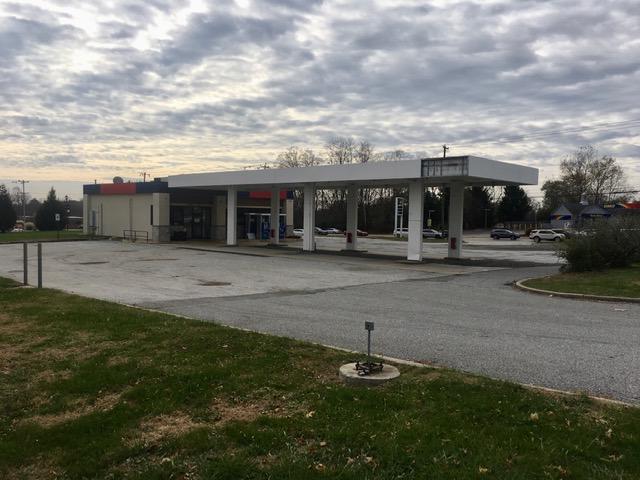
Commercial Land
1130 Baltimore Pike Glen Mills, PA 19342
1130 Baltimore Pike Glen Mills, PA 19342
Details & Description
Property Highlights
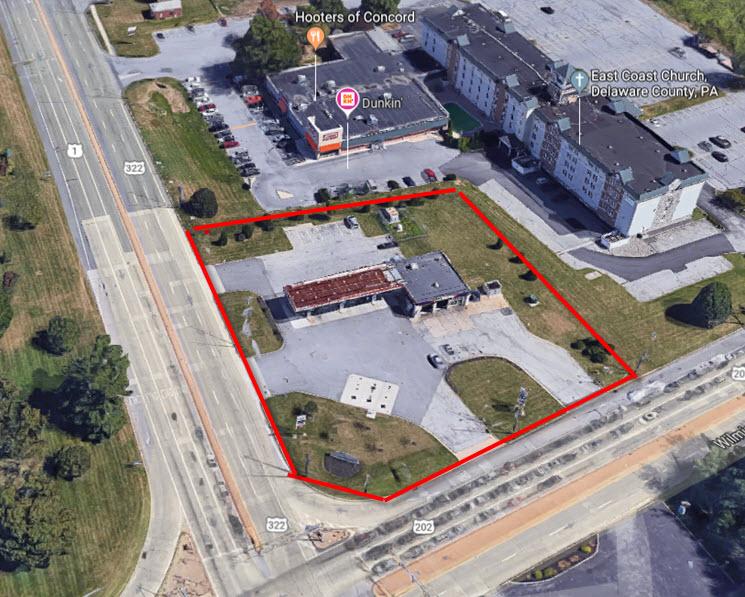
• Surrounding retailers include Wegmans, Home Depot, Target, AMC, Chic-fil-A, Texas Roadhouse, Wawa and many more.
• 1.7 Acres on Traffic Light Corner One of the busiest intersections in PA.
Listing Agents

Jeffrey Dowd
O: 610-359-1100
M: 610-842-4383
jdowd@zmcre.com
O: 610-359-1100
M: 610-842-4383
jdowd@zmcre.com
While we strive to provide the most accurate information, all listing information, and demographic data, is provided by third-parties. As such, MyEListing will not be responsible for the accuracy of the information. It is strongly recommended that you verify all information with the listing agent, and any relevant agencies, prior to making any decisions.