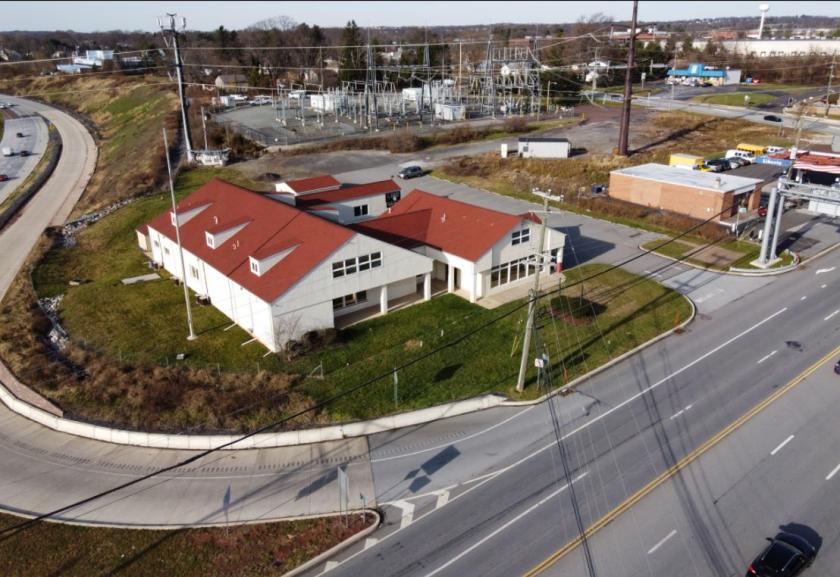
1-Mile | 3-Miles | 5-Miles | ||
---|---|---|---|---|
Total Population | 7,032 | 48,626 | 161,420 | |
Population Median Age | 42 | 41 | 39 | |
Population by Age | 0-9 Yrs | 668 (9%) | 5059 (10%) | 19988 (12%) |
10-19 Yrs | 562 (7%) | 5333 (10%) | 19795 (12%) | |
20-29 Yrs | 1136 (16%) | 6142 (12%) | 20678 (12%) | |
30-39 Yrs | 1343 (19%) | 7141 (14%) | 23305 (14%) | |
40-49 Yrs | 713 (10%) | 6227 (12%) | 21128 (13%) | |
50-59 Yrs | 706 (10%) | 6913 (14%) | 22697 (14%) | |
60-69 Yrs | 506 (7%) | 5135 (10%) | 17035 (10%) | |
70+ Yrs | 1398 (19%) | 6676 (13%) | 16793 (10%) | |
Median HH Income | $84,819 | $95,101 | $89,440 | |
Total Household Income | < 24K | 434 (12%) | 1728 (8%) | 7306 (11%) |
25-49K | 601 (17%) | 2857 (14%) | 10105 (16%) | |
50-74K | 482 (13%) | 2913 (14%) | 9189 (14%) | |
75-99K | 629 (17%) | 3019 (15%) | 8322 (13%) | |
100-199K | 1046 (29%) | 6454 (32%) | 18040 (28%) | |
200K+ | 336 (9%) | 2881 (14%) | 9852 (15%) | |
Highest Education Level | No Diploma | 174 | 1556 | 8102 |
Diploma or GED | 675 | 7077 | 24491 | |
Some College | 777 | 4601 | 14303 | |
Assoc. Degree | 466 | 2279 | 6855 | |
Bachelors Degree | 1813 | 11872 | 33208 | |
Higher Degree | 1531 | 8179 | 25221 | |
Total Housing Units | 3,766 | 21,011 | 67,572 | |
--Owner-Occupied | 1,476 | 13,373 | 40,340 | |
--Renter-Occupied | 2,051 | 6,479 | 22,474 | |
Owner-Occupied Values | < 100K | 77 | 410 | 1962 |
100-199K | 396 | 1857 | 6742 | |
200-299K | 556 | 3597 | 9208 | |
300-399K | 342 | 4160 | 8472 | |
400-499K | 50 | 1234 | 4274 | |
500K+ | 55 | 2115 | 9682 | |
Total Working Age Population | 6,010 | 40,359 | 129,331 | |
In Work Force | 3,870 | 26,382 | 88,085 | |
Not In Work Force | 2,141 | 13,977 | 41,246 | |
Workforce Employed | 3,697 | 25,326 | 83,972 | |
Workforce Unemployed | 172 | 1,050 | 4,041 | |
Civlian Workforce | 3,870 | 26,376 | 88,013 | |
Military Workforce | 0 | 5 | 72 | |
Total Households | 3,527 | 19,852 | 62,814 | |
Family Households | 1,801 | 12,806 | 41,266 | |
Non-Family Households | 1,726 | 7,047 | 21,549 | |
Married Couple | 1,528 | 10,924 | 31,983 | |
Other Family | 273 | 1,882 | 9,282 | |
Married w/Child | 506 | 4,228 | 13,619 | |
Single Male w/Child | 16 | 130 | 1,061 | |
Single Female w/Child | 85 | 609 | 3,949 |
Population Change Last Two Decades - Plus Projection
2000 | % | 2010 | % | 2020 | % | 2030 | |
---|---|---|---|---|---|---|---|
Pennsylvania | 12,281,054 | +3 | 12,702,379 | +4 | 13,230,170 | +4 | 13,759,594 |
Bucks County | 597,635 | +5 | 625,249 | +1 | 629,420 | +1 | 637,730 |
Chester County | 433,501 | +15 | 498,886 | +7 | 533,837 | +7 | 573,576 |
Delaware County | 550,864 | +1 | 558,979 | +5 | 588,436 | +6 | 622,307 |
Montgomery County | 750,097 | +7 | 799,874 | +5 | 838,883 | +6 | 891,868 |
Total Working Age Population:
Total Households:
Total Working Age Population:
Total Households:
Total Working Age Population:
Total Households: