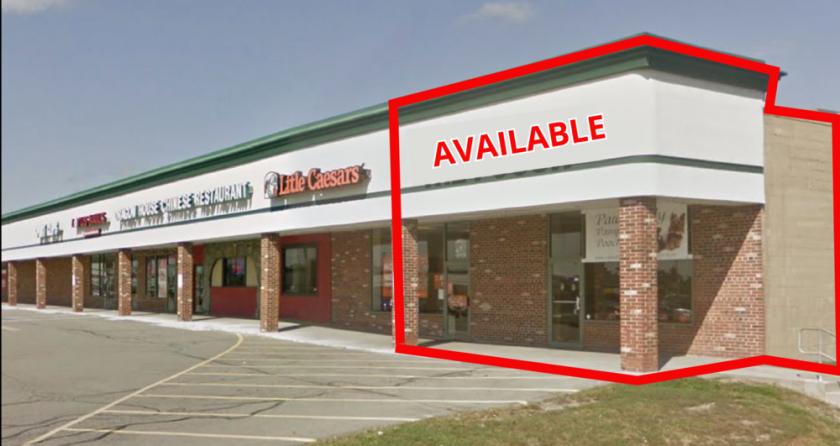
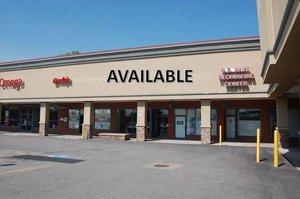
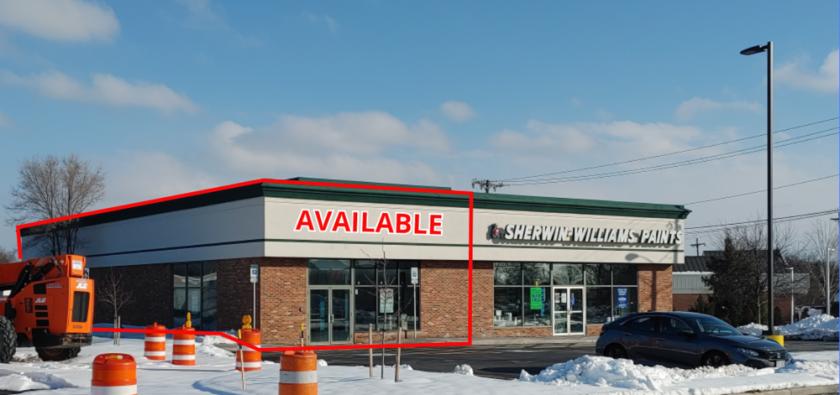
1-Mile | 3-Miles | 5-Miles | ||
---|---|---|---|---|
Total Population | 7,983 | 43,085 | 101,974 | |
Population Median Age | 44 | 42 | 43 | |
Population by Age | 0-9 Yrs | 1008 (12%) | 5016 (11%) | 10939 (10%) |
10-19 Yrs | 929 (11%) | 5023 (11%) | 12981 (12%) | |
20-29 Yrs | 550 (6%) | 4299 (9%) | 9843 (9%) | |
30-39 Yrs | 1003 (12%) | 5024 (11%) | 11392 (11%) | |
40-49 Yrs | 799 (10%) | 4886 (11%) | 11845 (11%) | |
50-59 Yrs | 1113 (13%) | 6719 (15%) | 15429 (15%) | |
60-69 Yrs | 1105 (13%) | 6064 (14%) | 14288 (14%) | |
70+ Yrs | 1475 (18%) | 6055 (14%) | 15257 (14%) | |
Median HH Income | $66,761 | $72,895 | $82,496 | |
Total Household Income | < 24K | 544 (16%) | 2731 (15%) | 5115 (12%) |
25-49K | 685 (20%) | 3222 (17%) | 6901 (16%) | |
50-74K | 652 (19%) | 3327 (18%) | 7079 (17%) | |
75-99K | 295 (8%) | 2130 (11%) | 5413 (13%) | |
100-199K | 905 (26%) | 5145 (28%) | 12681 (30%) | |
200K+ | 288 (8%) | 1488 (8%) | 4248 (10%) | |
Highest Education Level | No Diploma | 322 | 1687 | 3201 |
Diploma or GED | 897 | 4918 | 10737 | |
Some College | 1100 | 5087 | 11277 | |
Assoc. Degree | 568 | 3227 | 8129 | |
Bachelors Degree | 1572 | 8900 | 21455 | |
Higher Degree | 1351 | 7337 | 18351 | |
Total Housing Units | 3,577 | 19,150 | 43,798 | |
--Owner-Occupied | 2,499 | 13,645 | 32,970 | |
--Renter-Occupied | 868 | 4,397 | 8,467 | |
Owner-Occupied Values | < 100K | 67 | 1110 | 2502 |
100-199K | 1189 | 6218 | 14650 | |
200-299K | 864 | 4464 | 10228 | |
300-399K | 296 | 1297 | 3760 | |
400-499K | 47 | 298 | 920 | |
500K+ | 36 | 257 | 911 | |
Total Working Age Population | 6,320 | 34,833 | 83,557 | |
In Work Force | 3,861 | 22,596 | 53,323 | |
Not In Work Force | 2,458 | 12,237 | 30,233 | |
Workforce Employed | 3,731 | 21,876 | 51,735 | |
Workforce Unemployed | 131 | 714 | 1,580 | |
Civlian Workforce | 3,861 | 22,590 | 53,314 | |
Military Workforce | 0 | 6 | 9 | |
Total Households | 3,368 | 18,042 | 41,438 | |
Family Households | 2,162 | 11,816 | 27,840 | |
Non-Family Households | 1,205 | 6,226 | 13,598 | |
Married Couple | 1,768 | 9,586 | 23,162 | |
Other Family | 394 | 2,230 | 4,678 | |
Married w/Child | 605 | 3,395 | 8,223 | |
Single Male w/Child | 63 | 340 | 616 | |
Single Female w/Child | 208 | 964 | 1,952 |
Population Change Last Two Decades - Plus Projection
2000 | % | 2010 | % | 2020 | % | 2030 | |
---|---|---|---|---|---|---|---|
New York | 18,976,457 | +2 | 19,378,102 | +4 | 20,146,131 | +2 | 20,604,030 |
Monroe County | 735,343 | +1 | 744,344 | +1 | 754,529 | +1 | 758,536 |
Wayne County | 93,765 | 0 | 93,772 | -4 | 89,564 | -3 | 86,754 |
Total Working Age Population:
Total Households:
Total Working Age Population:
Total Households:
Total Working Age Population:
Total Households: