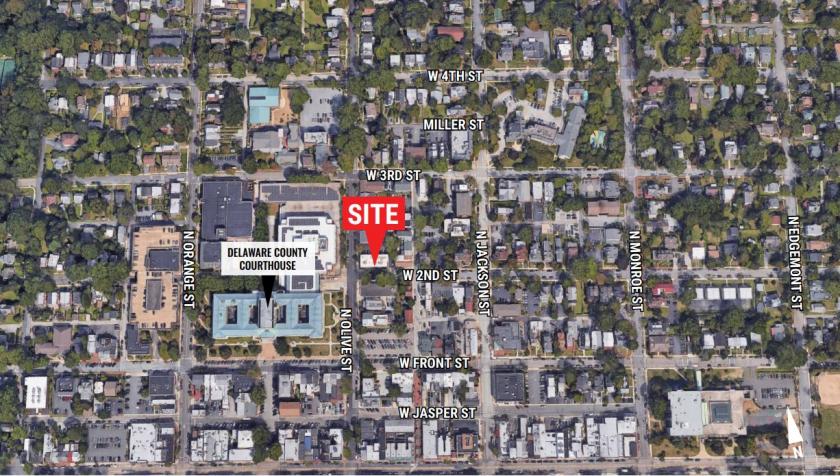
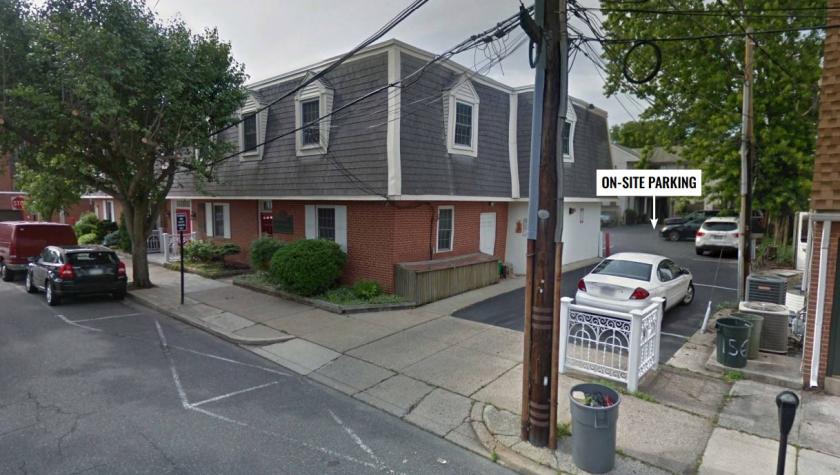
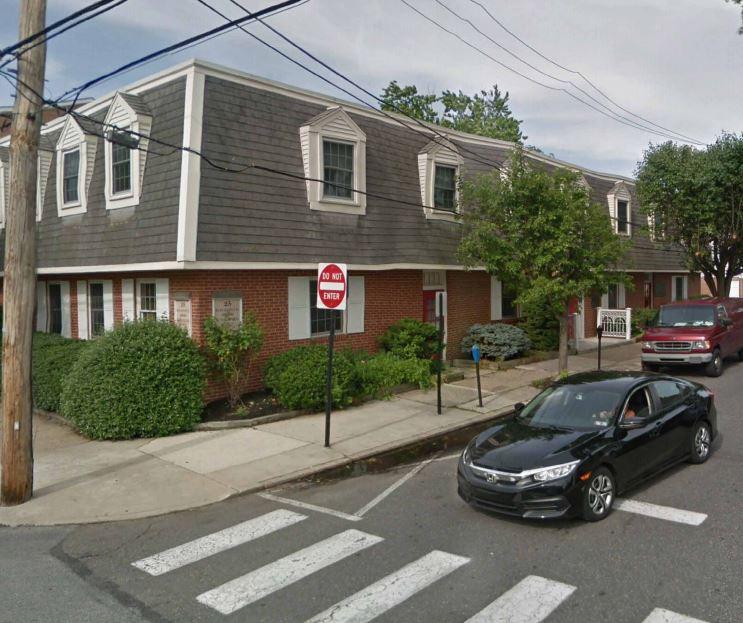
1-Mile | 3-Miles | 5-Miles | ||
---|---|---|---|---|
Total Population | 11,797 | 58,939 | 239,484 | |
Population Median Age | 41 | 42 | 41 | |
Population by Age | 0-9 Yrs | 1217 (10%) | 6593 (11%) | 28212 (11%) |
10-19 Yrs | 1107 (9%) | 7017 (11%) | 28582 (11%) | |
20-29 Yrs | 1434 (12%) | 6221 (10%) | 30002 (12%) | |
30-39 Yrs | 1956 (16%) | 6458 (10%) | 30169 (12%) | |
40-49 Yrs | 1560 (13%) | 7364 (12%) | 28003 (11%) | |
50-59 Yrs | 1666 (14%) | 8748 (14%) | 33918 (14%) | |
60-69 Yrs | 1615 (13%) | 8083 (13%) | 30196 (12%) | |
70+ Yrs | 1243 (10%) | 8455 (14%) | 30401 (12%) | |
Median HH Income | $91,179 | $105,345 | $83,014 | |
Total Household Income | < 24K | 518 (9%) | 2016 (8%) | 12122 (13%) |
25-49K | 921 (17%) | 3064 (13%) | 15679 (17%) | |
50-74K | 838 (15%) | 3148 (13%) | 13807 (15%) | |
75-99K | 594 (11%) | 2657 (11%) | 11998 (13%) | |
100-199K | 1744 (32%) | 7642 (33%) | 27062 (29%) | |
200K+ | 709 (13%) | 4374 (19%) | 10242 (11%) | |
Highest Education Level | No Diploma | 283 | 1103 | 9237 |
Diploma or GED | 1348 | 8028 | 49247 | |
Some College | 1316 | 6096 | 27660 | |
Assoc. Degree | 621 | 2927 | 13737 | |
Bachelors Degree | 2737 | 11774 | 38653 | |
Higher Degree | 2548 | 12127 | 29275 | |
Total Housing Units | 5,642 | 24,164 | 97,396 | |
--Owner-Occupied | 3,005 | 17,807 | 66,466 | |
--Renter-Occupied | 2,318 | 5,096 | 24,444 | |
Owner-Occupied Values | < 100K | 73 | 696 | 5253 |
100-199K | 249 | 1561 | 15269 | |
200-299K | 632 | 3492 | 18424 | |
300-399K | 872 | 4811 | 14366 | |
400-499K | 561 | 3210 | 6426 | |
500K+ | 619 | 4037 | 6727 | |
Total Working Age Population | 9,821 | 48,250 | 194,534 | |
In Work Force | 7,317 | 31,772 | 128,325 | |
Not In Work Force | 2,504 | 16,478 | 66,209 | |
Workforce Employed | 6,987 | 30,305 | 121,864 | |
Workforce Unemployed | 329 | 1,438 | 6,397 | |
Civlian Workforce | 7,316 | 31,743 | 128,261 | |
Military Workforce | 2 | 29 | 64 | |
Total Households | 5,323 | 22,902 | 90,910 | |
Family Households | 2,864 | 15,388 | 60,649 | |
Non-Family Households | 2,459 | 7,514 | 30,261 | |
Married Couple | 2,306 | 13,081 | 46,241 | |
Other Family | 558 | 2,307 | 14,408 | |
Married w/Child | 923 | 5,163 | 18,670 | |
Single Male w/Child | 69 | 388 | 1,929 | |
Single Female w/Child | 148 | 523 | 4,597 |
Population Change Last Two Decades - Plus Projection
2000 | % | 2010 | % | 2020 | % | 2030 | |
---|---|---|---|---|---|---|---|
New Jersey | 8,414,350 | +4 | 8,791,894 | +4 | 9,132,700 | +4 | 9,530,900 |
Gloucester County | 254,673 | +13 | 288,288 | +1 | 292,000 | +5 | 305,800 |
Pennsylvania | 12,281,054 | +3 | 12,702,379 | +4 | 13,230,170 | +4 | 13,759,594 |
Chester County | 433,501 | +15 | 498,886 | +7 | 533,837 | +7 | 573,576 |
Delaware County | 550,864 | +1 | 558,979 | +5 | 588,436 | +6 | 622,307 |
Montgomery County | 750,097 | +7 | 799,874 | +5 | 838,883 | +6 | 891,868 |
Total Working Age Population:
Total Households:
Total Working Age Population:
Total Households:
Total Working Age Population:
Total Households: