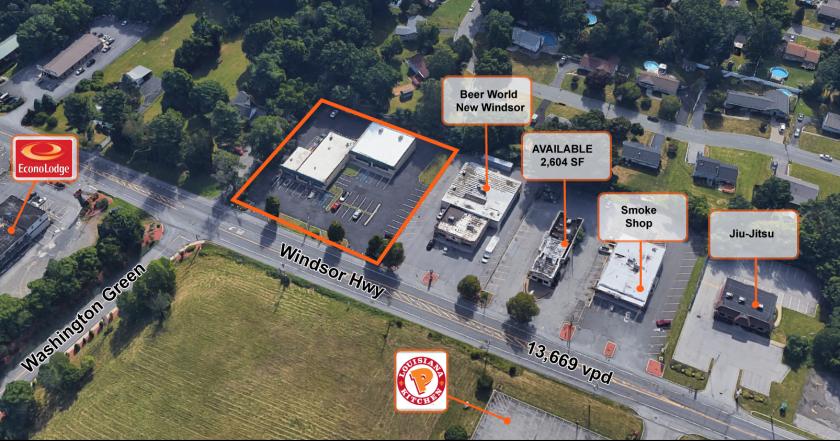
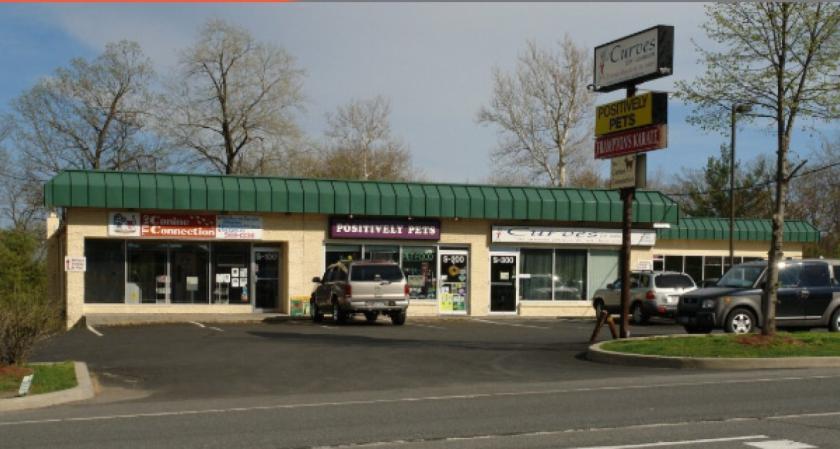
1-Mile | 3-Miles | 5-Miles | ||
---|---|---|---|---|
Total Population | 6,104 | 45,920 | 91,113 | |
Population Median Age | 42 | 38 | 38 | |
Population by Age | 0-9 Yrs | 565 (9%) | 5936 (12%) | 11495 (12%) |
10-19 Yrs | 802 (13%) | 7056 (15%) | 12903 (14%) | |
20-29 Yrs | 702 (11%) | 5571 (12%) | 12225 (13%) | |
30-39 Yrs | 865 (14%) | 5912 (12%) | 12003 (13%) | |
40-49 Yrs | 766 (12%) | 6023 (13%) | 11439 (12%) | |
50-59 Yrs | 738 (12%) | 6028 (13%) | 12267 (13%) | |
60-69 Yrs | 818 (13%) | 4808 (10%) | 9841 (10%) | |
70+ Yrs | 847 (13%) | 4585 (9%) | 8940 (9%) | |
Median HH Income | $66,403 | $69,719 | $65,684 | |
Total Household Income | < 24K | 493 (18%) | 2924 (17%) | 6549 (19%) |
25-49K | 645 (24%) | 3360 (20%) | 7222 (21%) | |
50-74K | 283 (10%) | 2669 (15%) | 5074 (15%) | |
75-99K | 386 (14%) | 2073 (12%) | 4077 (12%) | |
100-199K | 715 (27%) | 4518 (26%) | 8414 (24%) | |
200K+ | 119 (4%) | 1210 (7%) | 2466 (7%) | |
Highest Education Level | No Diploma | 444 | 3507 | 7179 |
Diploma or GED | 1251 | 9093 | 17820 | |
Some College | 953 | 5454 | 11248 | |
Assoc. Degree | 674 | 2871 | 5951 | |
Bachelors Degree | 633 | 5124 | 10028 | |
Higher Degree | 419 | 3815 | 7798 | |
Total Housing Units | 2,883 | 18,440 | 38,815 | |
--Owner-Occupied | 1,713 | 10,034 | 19,143 | |
--Renter-Occupied | 928 | 6,719 | 14,658 | |
Owner-Occupied Values | < 100K | 219 | 1207 | 1774 |
100-199K | 469 | 1953 | 4683 | |
200-299K | 771 | 3677 | 6690 | |
300-399K | 202 | 1847 | 3288 | |
400-499K | 36 | 952 | 1619 | |
500K+ | 17 | 398 | 1089 | |
Total Working Age Population | 5,109 | 35,853 | 72,235 | |
In Work Force | 3,259 | 23,564 | 47,474 | |
Not In Work Force | 1,850 | 12,290 | 24,760 | |
Workforce Employed | 3,083 | 22,496 | 44,563 | |
Workforce Unemployed | 165 | 942 | 2,457 | |
Civlian Workforce | 3,249 | 23,438 | 47,020 | |
Military Workforce | 10 | 126 | 455 | |
Total Households | 2,641 | 16,754 | 33,801 | |
Family Households | 1,382 | 10,866 | 21,348 | |
Non-Family Households | 1,259 | 5,888 | 12,454 | |
Married Couple | 1,013 | 7,600 | 14,214 | |
Other Family | 369 | 3,266 | 7,134 | |
Married w/Child | 439 | 3,337 | 5,980 | |
Single Male w/Child | 30 | 437 | 809 | |
Single Female w/Child | 222 | 1,520 | 3,322 |
Population Change Last Two Decades - Plus Projection
2000 | % | 2010 | % | 2020 | % | 2030 | |
---|---|---|---|---|---|---|---|
New York | 18,976,457 | +2 | 19,378,102 | +4 | 20,146,131 | +2 | 20,604,030 |
Dutchess County | 280,150 | +6 | 297,488 | -2 | 292,936 | -1 | 290,338 |
Orange County | 341,367 | +9 | 372,813 | +3 | 384,125 | +4 | 397,598 |
Putnam County | 95,745 | +4 | 99,710 | 0 | 99,274 | +1 | 100,199 |
Total Working Age Population:
Total Households:
Total Working Age Population:
Total Households:
Total Working Age Population:
Total Households: