Flex-Office-Warehouse
2 Raymond Drive Havertown, PA 19083
2 Raymond Drive Havertown, PA 19083

Details & Description
Property Highlights
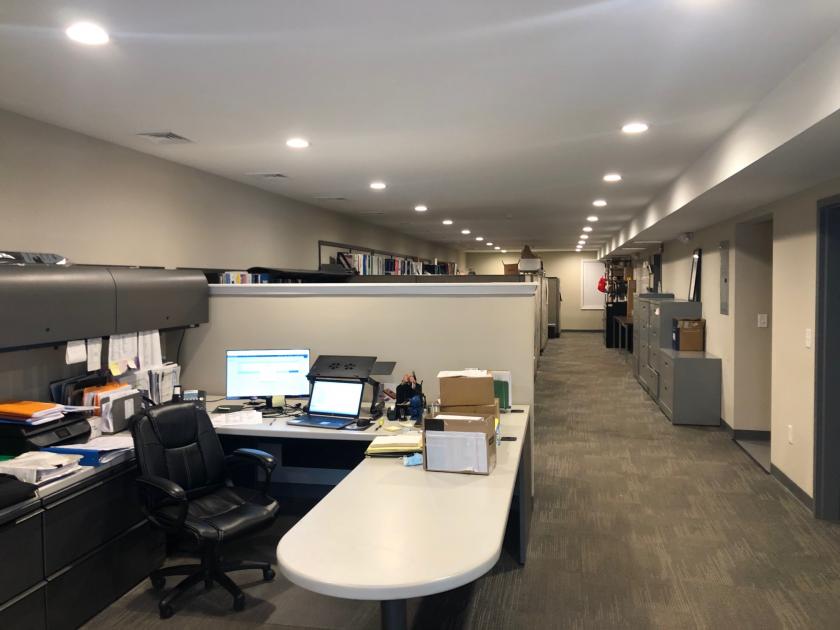
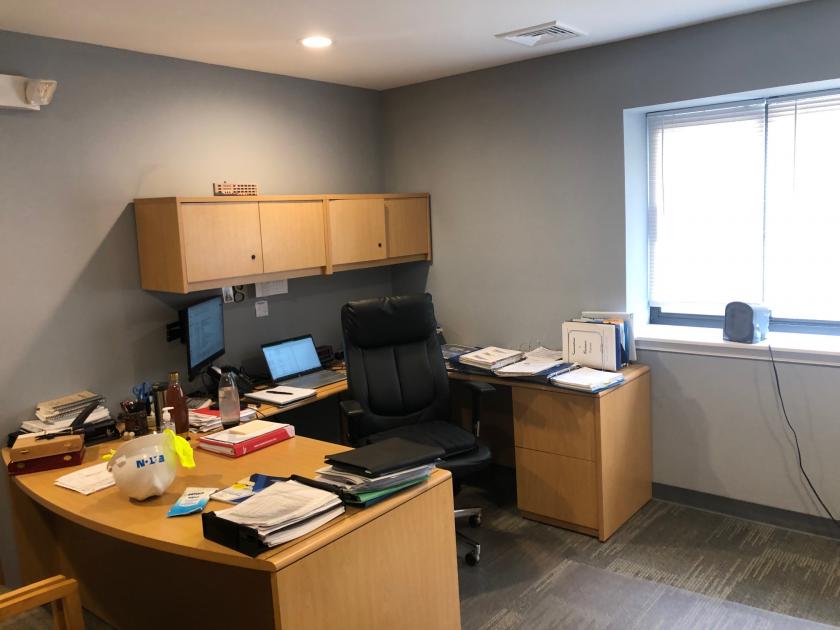
- • - 6,235 SF of Flex Space available
- • ON-SITE Management
- • 20 ceilings 17 under beam
- • Convenient to restaurants, banks and shopping
- • Public transportation bus nearby
Additional Photos


Listing Agents

Ron Casey
O: 610-359-1100
M: 610-764-5826
rcasey@zmcre.com
O: 610-359-1100
M: 610-764-5826
rcasey@zmcre.com
While we strive to provide the most accurate information, all listing information, and demographic data, is provided by third-parties. As such, MyEListing will not be responsible for the accuracy of the information. It is strongly recommended that you verify all information with the listing agent, and any relevant agencies, prior to making any decisions.


