Retail Space
2601 Market Street Aston, PA 19014
2601 Market Street Aston, PA 19014
Details & Description
Property Highlights
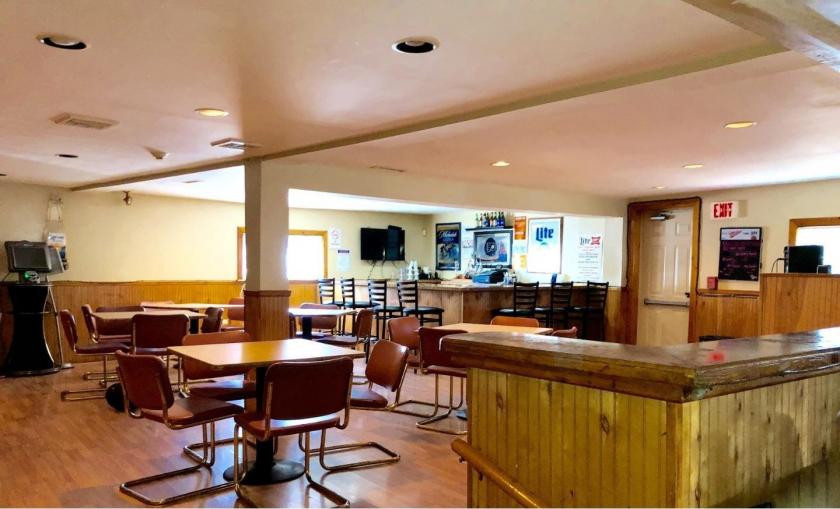
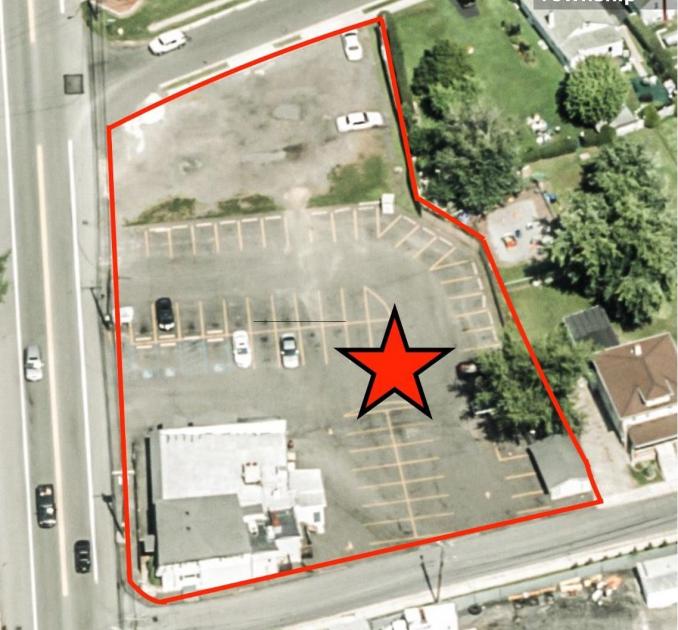
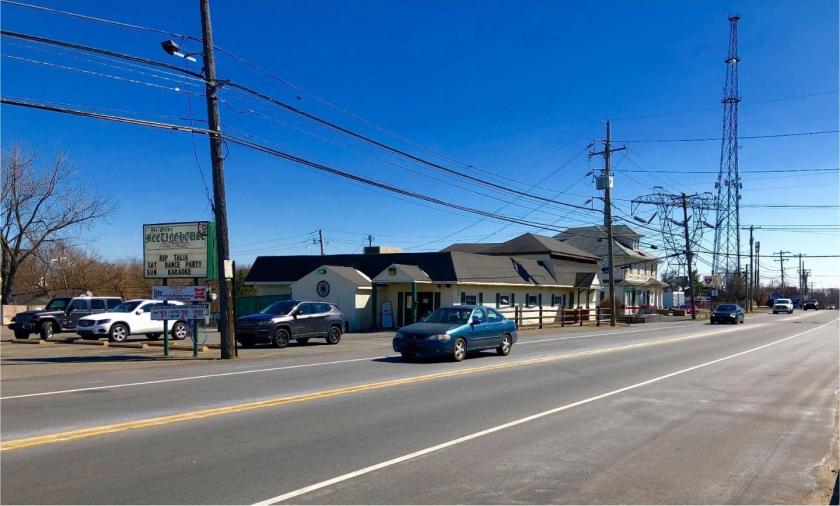
• Features - 4,600 sf bldg, 243 Ft of road frontage on Rt 452, right near the I-95 exit.
• 2 levels of bars, Dining Rm, dance floor, full kitchen and private 2nd floor.
Listing Agents

Ron Casey
O: 610-359-1100
M: 610-764-5826
rcasey@zmcre.com
O: 610-359-1100
M: 610-764-5826
rcasey@zmcre.com
While we strive to provide the most accurate information, all listing information, and demographic data, is provided by third-parties. As such, MyEListing will not be responsible for the accuracy of the information. It is strongly recommended that you verify all information with the listing agent, and any relevant agencies, prior to making any decisions.