Health Care and Medical Properties
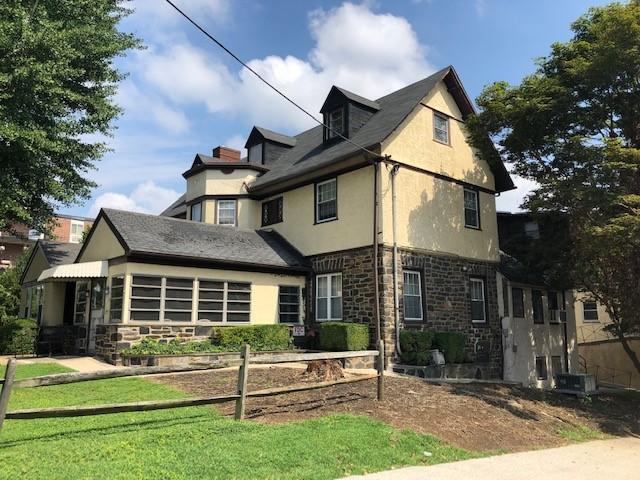
105 Morton Avenue Ridley Park, PA 19078
105 Morton Avenue Ridley Park, PA 19078

Details & Description
Property Highlights
• Bed Licenses are available for sale upon request.
• Bed Licenses are available for sale upon request.
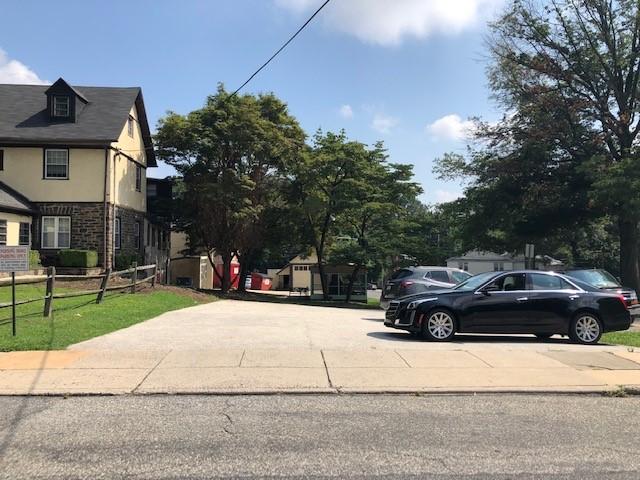
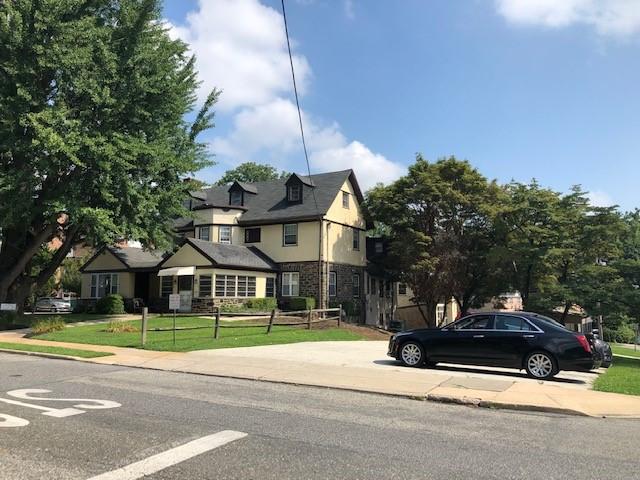
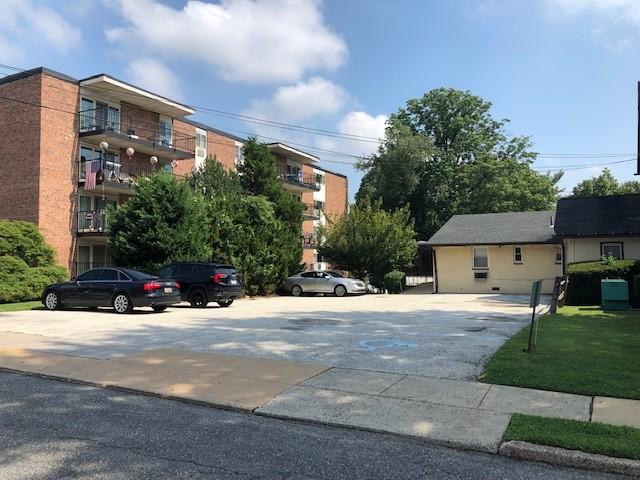
Additional Photos
Listing Agents

Ron Casey
O: 610-359-1100
M: 610-764-5826
rcasey@zmcre.com
O: 610-359-1100
M: 610-764-5826
rcasey@zmcre.com
While we strive to provide the most accurate information, all listing information, and demographic data, is provided by third-parties. As such, MyEListing will not be responsible for the accuracy of the information. It is strongly recommended that you verify all information with the listing agent, and any relevant agencies, prior to making any decisions.


