Retail Space
22410 Harper Avenue St Clair Shores, MI 48080
22410 Harper Avenue St Clair Shores, MI 48080
Details & Description
Property Highlights
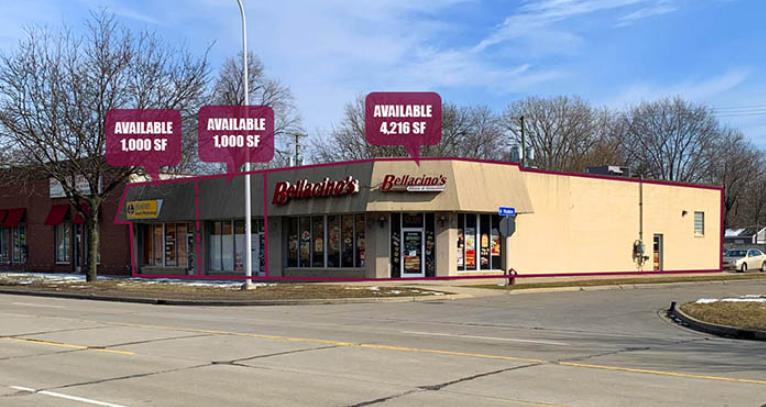
• The site offers a parking field which supports the restaurant use and is uncommon along the Harper Avenue corridor
• Former Bellacinos Pizza space is positioned at the endcap which offers great visibility and value-add opportunity
Listing Agents

Louis Ciotti
O: 248-488-2620
lciotti@landmarkcres.com
O: 248-488-2620
lciotti@landmarkcres.com
While we strive to provide the most accurate information, all listing information, and demographic data, is provided by third-parties. As such, MyEListing will not be responsible for the accuracy of the information. It is strongly recommended that you verify all information with the listing agent, and any relevant agencies, prior to making any decisions.


