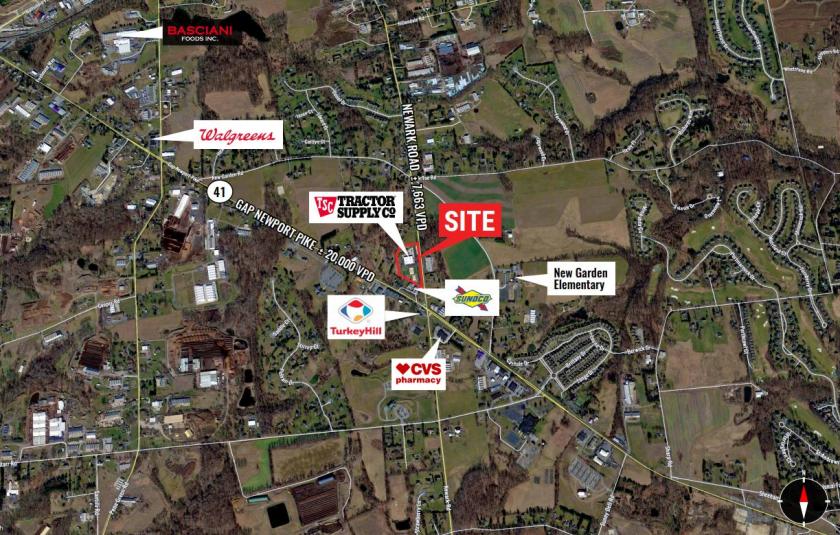
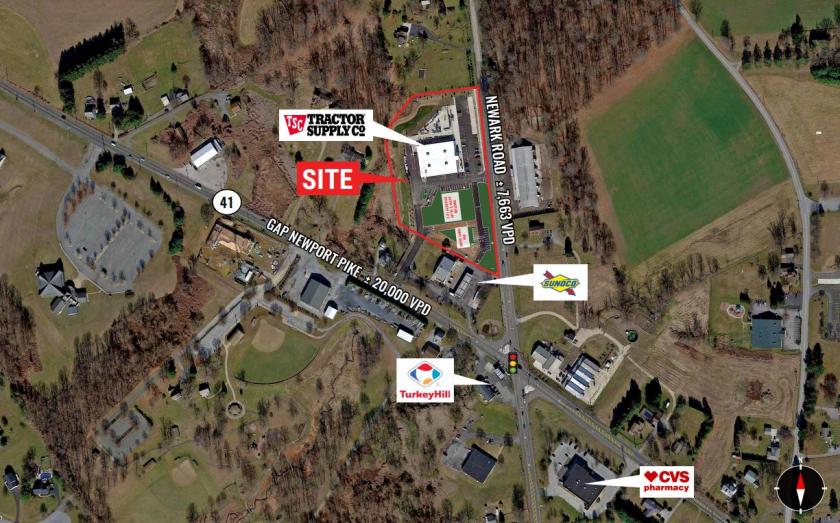
1-Mile | 3-Miles | 5-Miles | ||
---|---|---|---|---|
Total Population | 2,430 | 24,205 | 61,447 | |
Population Median Age | 40 | 39 | 40 | |
Population by Age | 0-9 Yrs | 250 (10%) | 2986 (12%) | 7400 (12%) |
10-19 Yrs | 331 (13%) | 3595 (14%) | 8738 (14%) | |
20-29 Yrs | 335 (13%) | 2748 (11%) | 6229 (10%) | |
30-39 Yrs | 255 (10%) | 2905 (12%) | 7204 (11%) | |
40-49 Yrs | 313 (12%) | 3062 (12%) | 7858 (12%) | |
50-59 Yrs | 459 (18%) | 4038 (16%) | 9979 (16%) | |
60-69 Yrs | 225 (9%) | 2798 (11%) | 7765 (12%) | |
70+ Yrs | 262 (10%) | 2073 (8%) | 6274 (10%) | |
Median HH Income | $118,578 | $114,979 | $113,233 | |
Total Household Income | < 24K | 46 (5%) | 565 (7%) | 1410 (6%) |
25-49K | 130 (16%) | 997 (12%) | 2549 (11%) | |
50-74K | 86 (10%) | 1021 (12%) | 2947 (13%) | |
75-99K | 67 (8%) | 904 (11%) | 2604 (12%) | |
100-199K | 254 (31%) | 2764 (34%) | 7256 (34%) | |
200K+ | 216 (27%) | 1778 (22%) | 4535 (21%) | |
Highest Education Level | No Diploma | 367 | 2528 | 4435 |
Diploma or GED | 294 | 3011 | 7648 | |
Some College | 174 | 1703 | 4919 | |
Assoc. Degree | 68 | 864 | 2530 | |
Bachelors Degree | 431 | 4236 | 12192 | |
Higher Degree | 327 | 3736 | 10393 | |
Total Housing Units | 857 | 8,361 | 22,337 | |
--Owner-Occupied | 672 | 6,523 | 17,387 | |
--Renter-Occupied | 127 | 1,506 | 3,914 | |
Owner-Occupied Values | < 100K | 9 | 191 | 465 |
100-199K | 41 | 373 | 973 | |
200-299K | 94 | 1016 | 2853 | |
300-399K | 221 | 1831 | 4661 | |
400-499K | 202 | 1886 | 4862 | |
500K+ | 105 | 1226 | 3574 | |
Total Working Age Population | 1,981 | 19,051 | 48,774 | |
In Work Force | 1,404 | 13,602 | 33,632 | |
Not In Work Force | 577 | 5,449 | 15,142 | |
Workforce Employed | 1,353 | 13,092 | 32,352 | |
Workforce Unemployed | 52 | 510 | 1,280 | |
Civlian Workforce | 1,404 | 13,602 | 33,632 | |
Military Workforce | 0 | 0 | 0 | |
Total Households | 799 | 8,029 | 21,302 | |
Family Households | 659 | 6,591 | 17,060 | |
Non-Family Households | 140 | 1,438 | 4,242 | |
Married Couple | 608 | 5,641 | 14,587 | |
Other Family | 52 | 950 | 2,473 | |
Married w/Child | 225 | 2,323 | 5,809 | |
Single Male w/Child | 7 | 188 | 569 | |
Single Female w/Child | 28 | 344 | 780 |
Population Change Last Two Decades - Plus Projection
2000 | % | 2010 | % | 2020 | % | 2030 | |
---|---|---|---|---|---|---|---|
Delaware | 783,600 | +15 | 897,934 | +10 | 989,803 | +6 | 1,044,965 |
New Castle County | 500,265 | +8 | 538,479 | +6 | 571,165 | +4 | 596,221 |
Pennsylvania | 12,281,054 | +3 | 12,702,379 | +4 | 13,230,170 | +4 | 13,759,594 |
Chester County | 433,501 | +15 | 498,886 | +7 | 533,837 | +7 | 573,576 |
Total Working Age Population:
Total Households:
Total Working Age Population:
Total Households:
Total Working Age Population:
Total Households: