Retail Space
343 Baltimore Boulevard Westminster, MD 21157
343 Baltimore Boulevard Westminster, MD 21157
Details & Description
Property Highlights
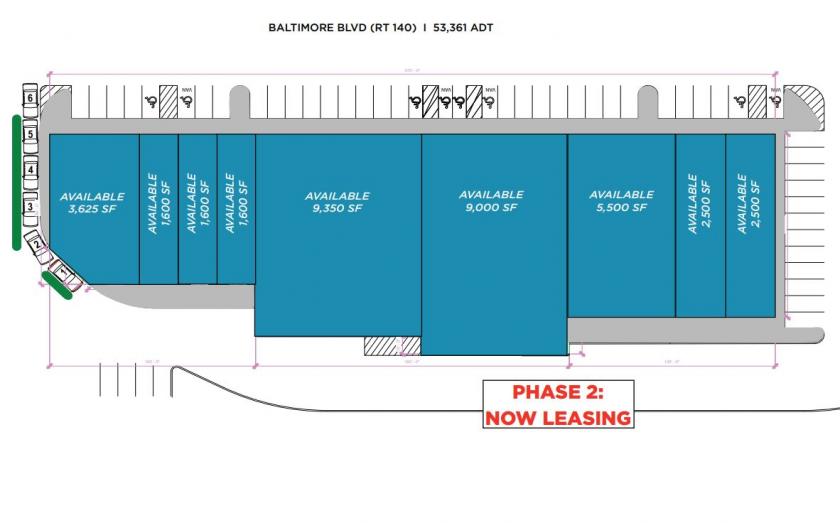
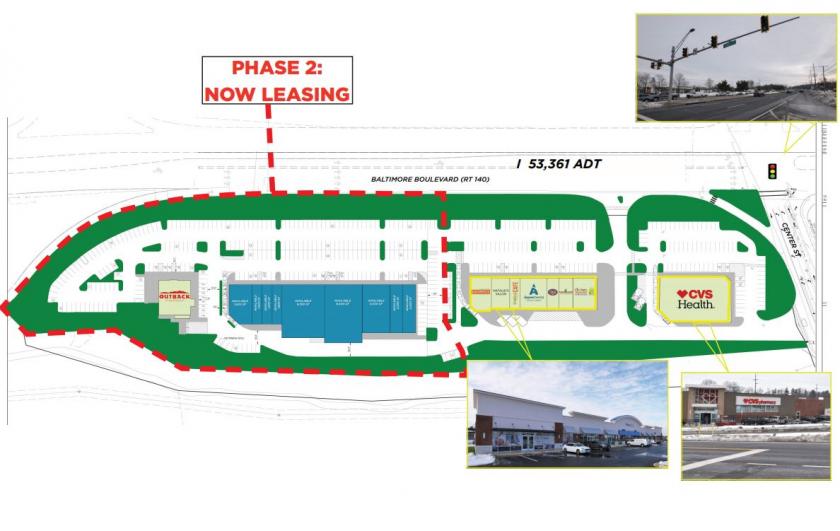
- • Now Leasing phase 2
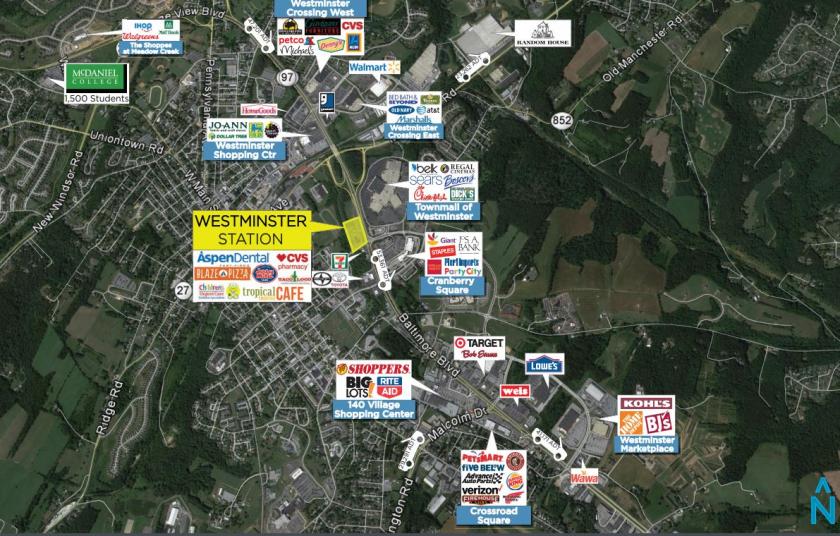
- • Excellent access and visibility on MD Route 140
- • Over 53,000 cars passing by each day
Listing Agents

Michael Stoltz
O: 410-308-0700
mstoltz@mfirealty.com
O: 410-308-0700
mstoltz@mfirealty.com
While we strive to provide the most accurate information, all listing information, and demographic data, is provided by third-parties. As such, MyEListing will not be responsible for the accuracy of the information. It is strongly recommended that you verify all information with the listing agent, and any relevant agencies, prior to making any decisions.