Retail Space
5350 West 25th Avenue Denver, CO 80212
5350 West 25th Avenue Denver, CO 80212

Details & Description
Property Highlights
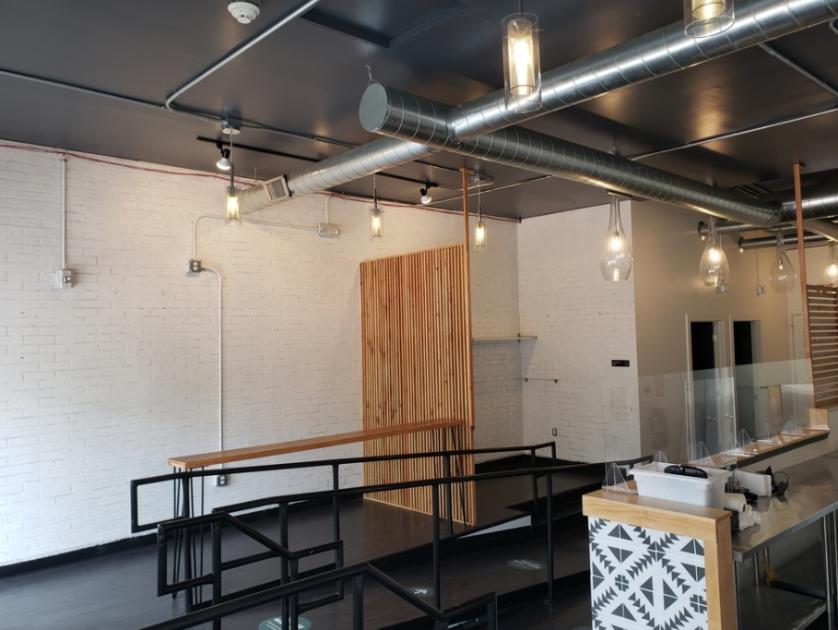
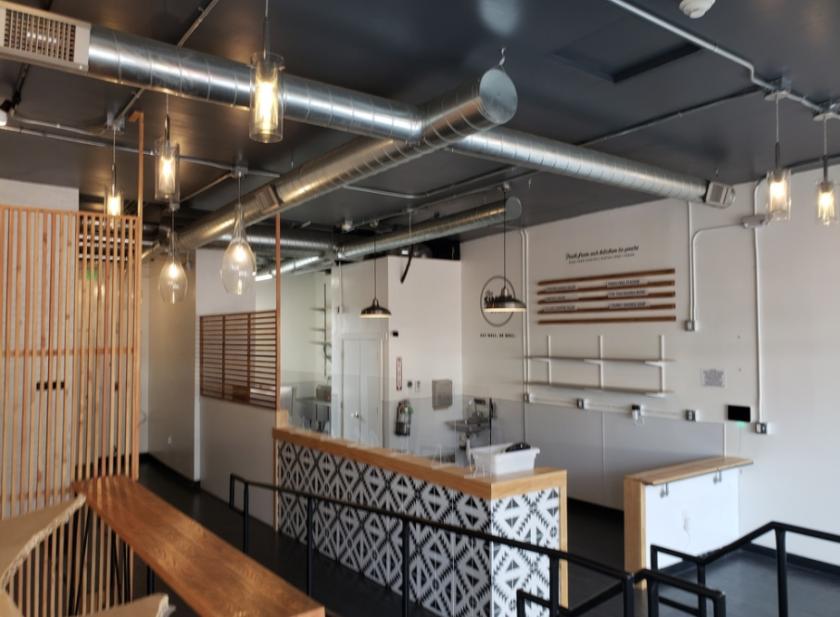
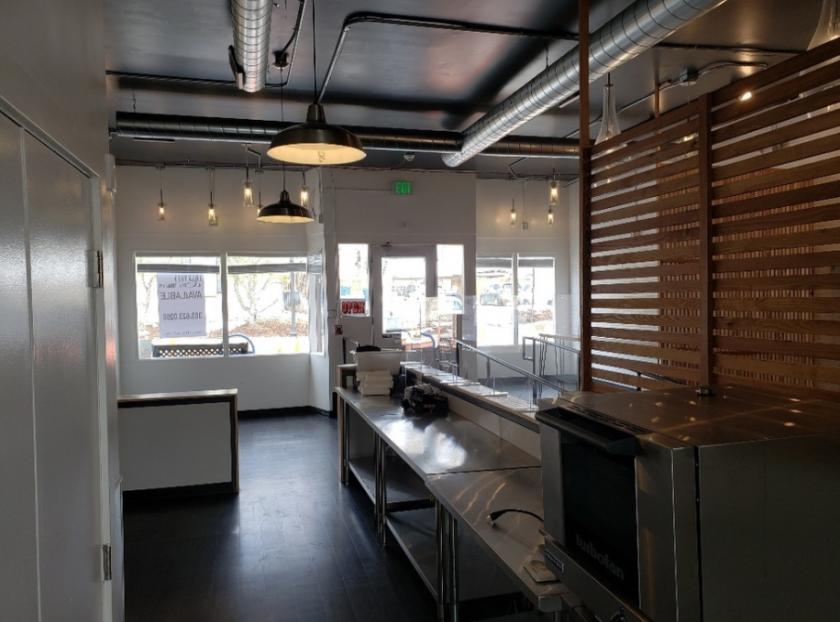
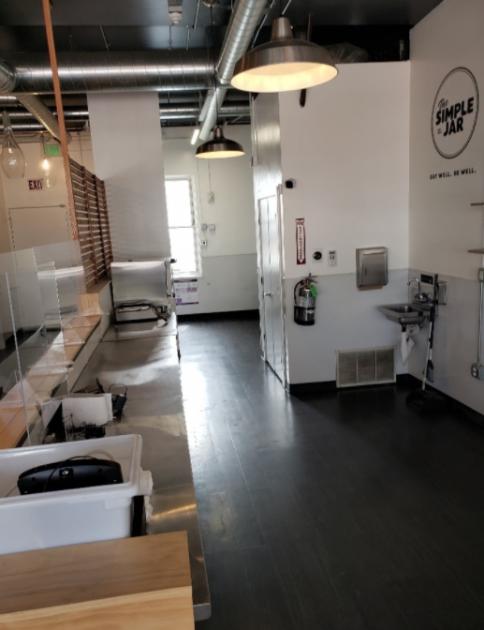
- • Beautiful, well-maintained main street space
- • Up and coming neighborhood
- • Corner Unit
- • Outdoor dining possible
Additional Photos
Listing Agents

Charles Nusbaum
O: 303-454-5420
cnusbaum@antonoff.com
O: 303-454-5420
cnusbaum@antonoff.com
While we strive to provide the most accurate information, all listing information, and demographic data, is provided by third-parties. As such, MyEListing will not be responsible for the accuracy of the information. It is strongly recommended that you verify all information with the listing agent, and any relevant agencies, prior to making any decisions.


