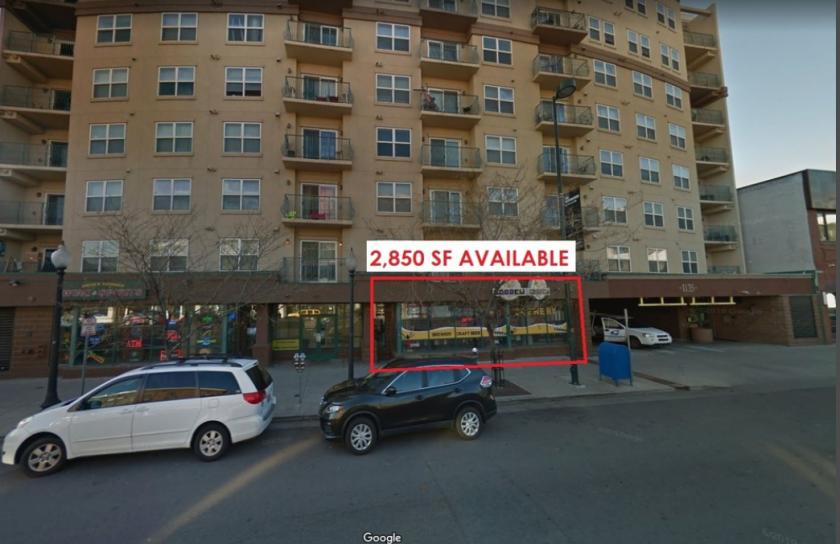
1-Mile | 3-Miles | 5-Miles | ||
---|---|---|---|---|
Total Population | 44,489 | 225,673 | 509,166 | |
Population Median Age | 37 | 37 | 37 | |
Population by Age | 0-9 Yrs | 1303 (2%) | 19160 (8%) | 53152 (10%) |
10-19 Yrs | 1597 (3%) | 15306 (6%) | 47941 (9%) | |
20-29 Yrs | 14354 (32%) | 51299 (22%) | 97877 (19%) | |
30-39 Yrs | 11969 (26%) | 54819 (24%) | 108237 (21%) | |
40-49 Yrs | 4860 (10%) | 28052 (12%) | 66789 (13%) | |
50-59 Yrs | 4599 (10%) | 22529 (9%) | 52051 (10%) | |
60-69 Yrs | 3913 (8%) | 19679 (8%) | 45703 (8%) | |
70+ Yrs | 1894 (4%) | 14829 (6%) | 37416 (7%) | |
Median HH Income | $58,889 | $69,872 | $67,511 | |
Total Household Income | < 24K | 6328 (22%) | 22056 (19%) | 42580 (18%) |
25-49K | 5482 (19%) | 19585 (17%) | 42904 (18%) | |
50-74K | 5176 (18%) | 18607 (16%) | 38554 (16%) | |
75-99K | 3307 (11%) | 12909 (11%) | 26854 (11%) | |
100-199K | 5668 (20%) | 27136 (23%) | 52202 (22%) | |
200K+ | 1945 (6%) | 13337 (11%) | 24256 (10%) | |
Highest Education Level | No Diploma | 1987 | 15917 | 43895 |
Diploma or GED | 4269 | 22174 | 60790 | |
Some College | 5714 | 24971 | 58970 | |
Assoc. Degree | 1930 | 7731 | 18317 | |
Bachelors Degree | 14811 | 65327 | 119097 | |
Higher Degree | 8974 | 41250 | 75346 | |
Total Housing Units | 30,197 | 123,996 | 244,471 | |
--Owner-Occupied | 7,236 | 44,248 | 105,320 | |
--Renter-Occupied | 20,670 | 69,382 | 122,029 | |
Owner-Occupied Values | < 100K | 274 | 919 | 2441 |
100-199K | 787 | 3318 | 8963 | |
200-299K | 1583 | 6167 | 17554 | |
300-399K | 1317 | 6915 | 19620 | |
400-499K | 1346 | 6935 | 17061 | |
500K+ | 1929 | 19994 | 39681 | |
Total Working Age Population | 42,689 | 197,602 | 427,741 | |
In Work Force | 34,571 | 151,466 | 313,379 | |
Not In Work Force | 8,117 | 46,136 | 114,362 | |
Workforce Employed | 33,003 | 145,535 | 300,828 | |
Workforce Unemployed | 1,554 | 5,897 | 12,317 | |
Civlian Workforce | 34,557 | 151,432 | 313,145 | |
Military Workforce | 14 | 34 | 234 | |
Total Households | 27,906 | 113,631 | 227,349 | |
Family Households | 5,393 | 40,198 | 101,451 | |
Non-Family Households | 22,513 | 73,432 | 125,897 | |
Married Couple | 4,054 | 29,113 | 72,097 | |
Other Family | 1,340 | 11,086 | 29,354 | |
Married w/Child | 635 | 9,968 | 29,341 | |
Single Male w/Child | 281 | 1,689 | 3,937 | |
Single Female w/Child | 276 | 3,666 | 10,194 |
Population Change Last Two Decades - Plus Projection
2000 | % | 2010 | % | 2020 | % | 2030 | |
---|---|---|---|---|---|---|---|
Colorado | 4,301,261 | +17 | 5,029,196 | +16 | 5,838,181 | +15 | 6,733,658 |
Adams County | 363,857 | +21 | 441,603 | +20 | 530,680 | +21 | 642,318 |
Arapahoe County | 487,967 | +17 | 572,003 | +16 | 662,304 | +13 | 750,773 |
Denver County | 554,636 | +8 | 600,158 | +23 | 738,611 | +12 | 827,681 |
Jefferson County | 527,056 | +1 | 534,543 | +10 | 587,118 | +7 | 626,742 |
Total Working Age Population:
Total Households:
Total Working Age Population:
Total Households:
Total Working Age Population:
Total Households: