Retail Space
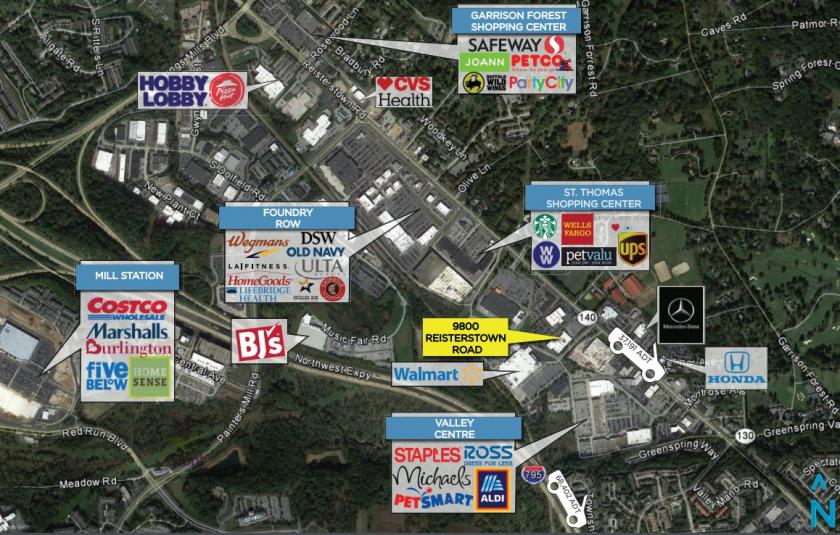
9800 Reisterstown Road Owings Mills, MD 21117
9800 Reisterstown Road Owings Mills, MD 21117
Details & Description
Property Highlights
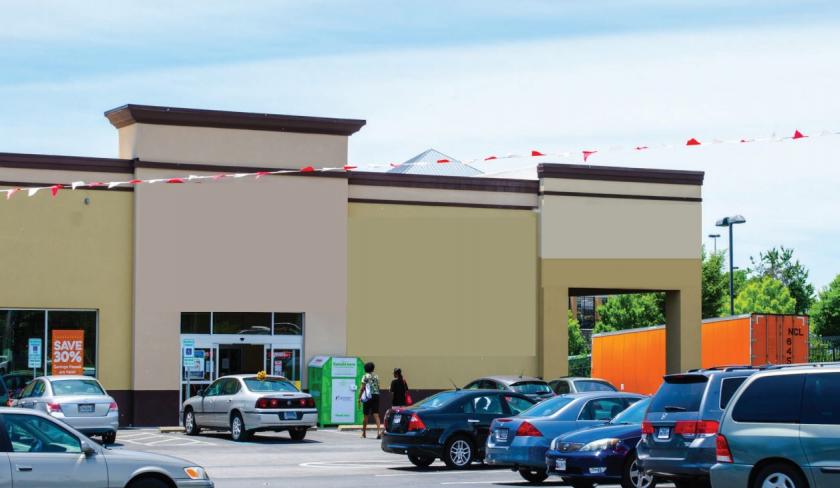
• 30,000 SF building for lease pad site up to 3,500 SF building available
• More than 37,000 cars passing by the site daily on Reisterstown Road
Listing Agents

Michael Stoltz
O: 410-308-0700
mstoltz@mfirealty.com
O: 410-308-0700
mstoltz@mfirealty.com
While we strive to provide the most accurate information, all listing information, and demographic data, is provided by third-parties. As such, MyEListing will not be responsible for the accuracy of the information. It is strongly recommended that you verify all information with the listing agent, and any relevant agencies, prior to making any decisions.