Retail Space
8223 Elliott Road Easton, MD 21601
8223 Elliott Road Easton, MD 21601

Details & Description
Property Highlights
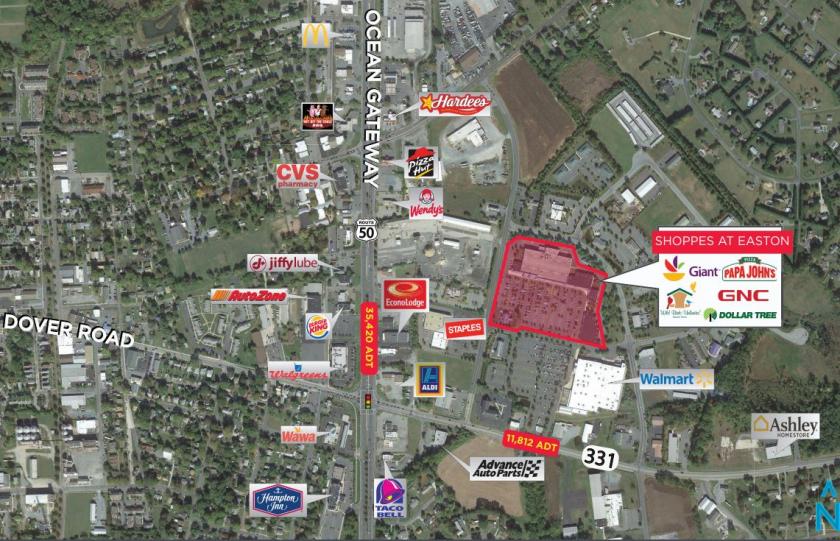
- • End-cap, inline and pad site available for lease
- • Site is situated off of Route 50 in Ocean Gateway
- • Anchored by Giant and Walmart
- • Over 35,000 cars pass the site daily
Listing Agents

Michael Kociemba
O: 410-308-0700
mk@mfirealty.com
O: 410-308-0700
mk@mfirealty.com
While we strive to provide the most accurate information, all listing information, and demographic data, is provided by third-parties. As such, MyEListing will not be responsible for the accuracy of the information. It is strongly recommended that you verify all information with the listing agent, and any relevant agencies, prior to making any decisions.