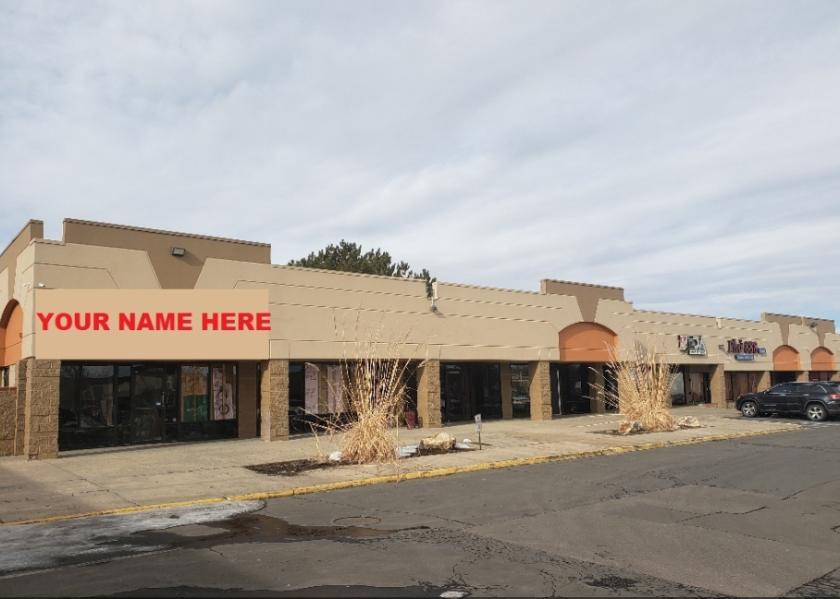
Retail Space
6th Ave. and Sable Blvd. Aurora, CO 80011
6th Ave. and Sable Blvd. Aurora, CO 80011

Details & Description
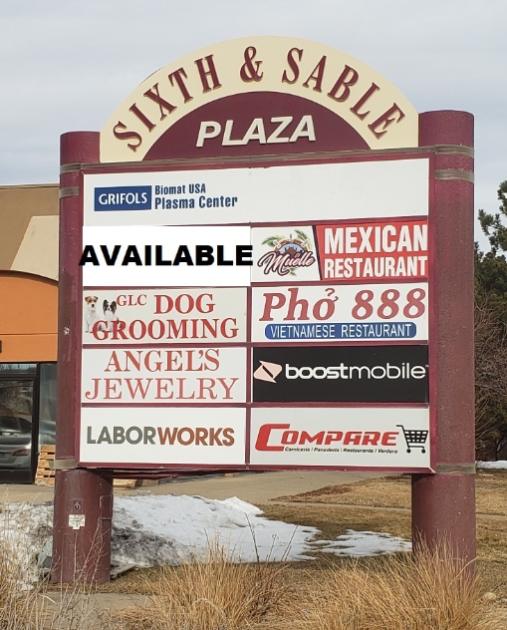
Property Highlights
- • Join DaVita, DMV, grocery, restaurants and school
- • 2.3 miles to Fitzsimons/Anschutz Medical
- • Walking distance to Light Rail
- • Ample parking
- • Monument signage
- • Local ownership/management
Additional Photos

Listing Agents

Charles Nusbaum
O: 303-454-5420
cnusbaum@antonoff.com
O: 303-454-5420
cnusbaum@antonoff.com
While we strive to provide the most accurate information, all listing information, and demographic data, is provided by third-parties. As such, MyEListing will not be responsible for the accuracy of the information. It is strongly recommended that you verify all information with the listing agent, and any relevant agencies, prior to making any decisions.