Great Business Opportunity!
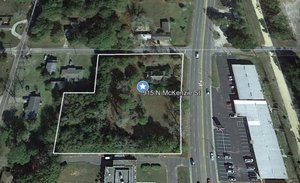
Flat lot with 15,000 SF office/warehouse building situated on approximately 2.69 acres. Owner is selling two lots adjoining to the north totaling 2.46 acres bringing the overall land total to 5.15 acres.
Lot 6 = 29,133 SF (.66 acres)
Lot 7 = 78,229SF (1.80 acres)
Lot 8 = 117,180 SF (2.69 acres) with office/warehouse
This property is in close proximity to regional and national businesses including McDonald's, Walgreens, Subway, Whataburger, O'Reilly Auto Parts, Regions Bank, etc.
Daily Traffic Count = 24,931
Office/Warehouse has sprinkler system.
3 Phase Power
Eave Height = 20'
Center Height = 25'
Center Column Spacing: 25' (50 x 25)
Exterior is brick & metal
No part of this information may be copied, reproduced, repurposed, or screen-captured for any commercial purpose without prior written authorization from MyEListing.
While we strive to provide the most accurate information, all listing information, and demographic data, is provided by third-parties. As such, MyEListing will not be responsible for the accuracy of the information. It is strongly recommended that you verify all information with the listing agent, and any relevant agencies, prior to making any decisions.
What is the asking price for 10023 Lifeline Court in Mobile?
The asking price for 10023 Lifeline Court is $850,000
What is the building size of this Industrial property in Mobile, AL?
The size of the building/unit at 10023 Lifeline Court in Mobile is 15,000 square feet
How much land does the Mobile, AL property at 10023 Lifeline Court include?
10023 Lifeline Court in Mobile includes 5.150 acres of land
What kind of Industrial is the propery at 10023 Lifeline Court?
The property at 10023 Lifeline Court Mobile, AL 36608 is listed as a Flex-Office-Warehouse Industrial property
What is the population within 1 mile of 10023 Lifeline Court in Mobile?
The population within 1 mile of 10023 Lifeline Court Mobile, AL 36608 is 1,244 people.
Who do I contact for questions about 10023 Lifeline Court?
You should contact the listing agent,
Mike Reid, for any details regarding this commercial listing.