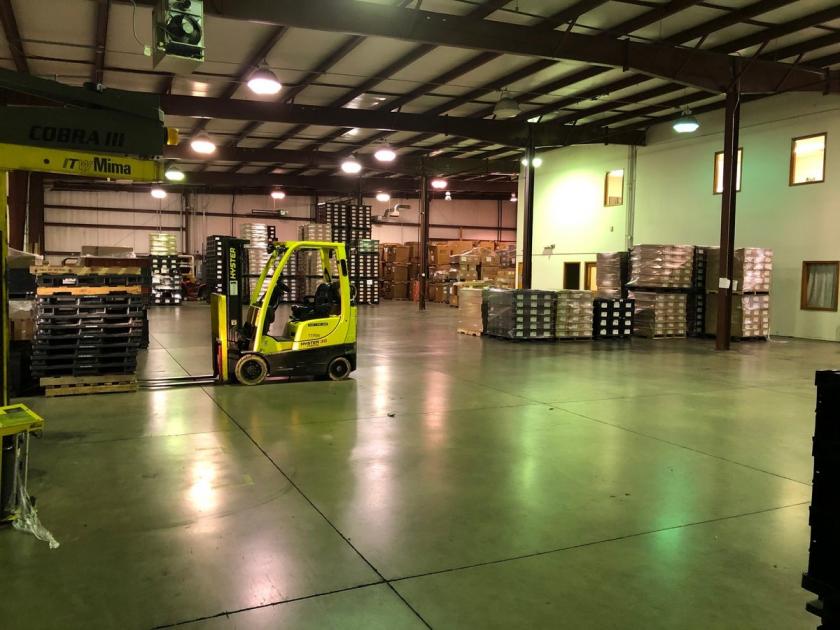
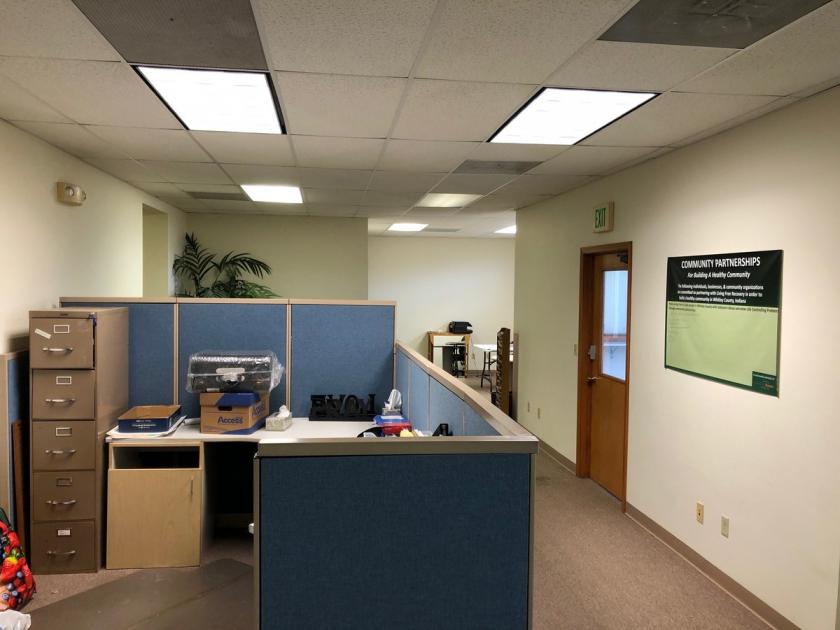
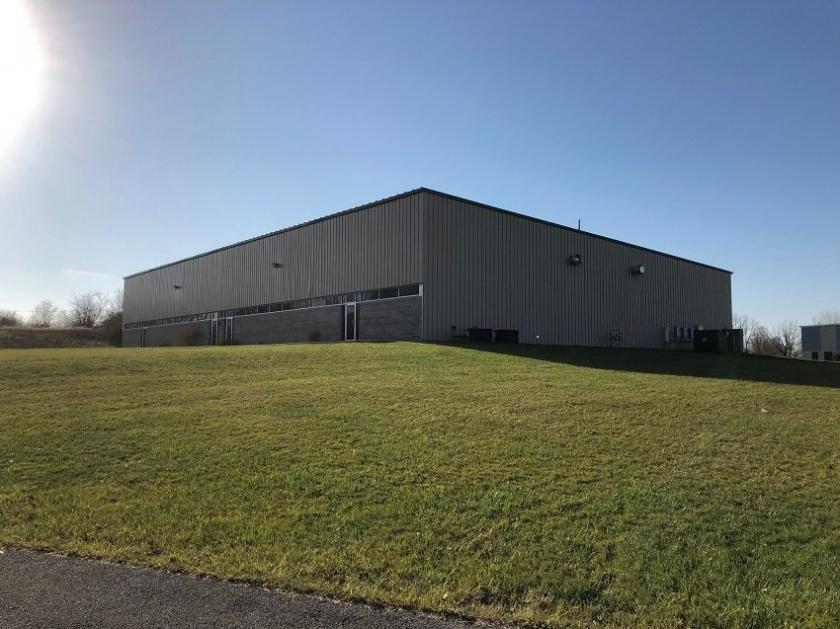
1-Mile | 3-Miles | 5-Miles | ||
---|---|---|---|---|
Total Population | 3,248 | 10,215 | 14,767 | |
Population Median Age | 38 | 39 | 40 | |
Population by Age | 0-9 Yrs | 428 (13%) | 1322 (12%) | 1915 (12%) |
10-19 Yrs | 510 (15%) | 1342 (13%) | 1773 (12%) | |
20-29 Yrs | 440 (13%) | 1427 (13%) | 1782 (12%) | |
30-39 Yrs | 460 (14%) | 1446 (14%) | 1953 (13%) | |
40-49 Yrs | 283 (8%) | 1091 (10%) | 1631 (11%) | |
50-59 Yrs | 350 (10%) | 1168 (11%) | 1923 (13%) | |
60-69 Yrs | 456 (14%) | 1325 (12%) | 2009 (13%) | |
70+ Yrs | 321 (9%) | 1095 (10%) | 1781 (12%) | |
Median HH Income | $51,064 | $51,914 | $55,381 | |
Total Household Income | < 24K | 290 (20%) | 748 (17%) | 999 (15%) |
25-49K | 407 (28%) | 1377 (31%) | 1891 (30%) | |
50-74K | 378 (26%) | 956 (21%) | 1277 (20%) | |
75-99K | 178 (12%) | 549 (12%) | 908 (14%) | |
100-199K | 149 (10%) | 599 (13%) | 972 (15%) | |
200K+ | 23 (1%) | 160 (3%) | 229 (3%) | |
Highest Education Level | No Diploma | 237 | 622 | 881 |
Diploma or GED | 793 | 2490 | 3837 | |
Some College | 269 | 1039 | 1686 | |
Assoc. Degree | 254 | 866 | 1310 | |
Bachelors Degree | 353 | 1189 | 1672 | |
Higher Degree | 185 | 539 | 760 | |
Total Housing Units | 1,452 | 4,603 | 6,566 | |
--Owner-Occupied | 1,030 | 3,292 | 4,858 | |
--Renter-Occupied | 395 | 1,096 | 1,417 | |
Owner-Occupied Values | < 100K | 358 | 1023 | 1271 |
100-199K | 580 | 1574 | 2321 | |
200-299K | 80 | 483 | 864 | |
300-399K | 3 | 72 | 184 | |
400-499K | 1 | 15 | 41 | |
500K+ | 7 | 125 | 177 | |
Total Working Age Population | 2,606 | 8,243 | 11,930 | |
In Work Force | 1,791 | 5,472 | 7,826 | |
Not In Work Force | 815 | 2,771 | 4,103 | |
Workforce Employed | 1,633 | 5,176 | 7,439 | |
Workforce Unemployed | 157 | 293 | 379 | |
Civlian Workforce | 1,791 | 5,468 | 7,818 | |
Military Workforce | 0 | 3 | 8 | |
Total Households | 1,425 | 4,388 | 6,276 | |
Family Households | 922 | 2,741 | 4,091 | |
Non-Family Households | 503 | 1,647 | 2,184 | |
Married Couple | 641 | 2,023 | 3,145 | |
Other Family | 281 | 718 | 946 | |
Married w/Child | 224 | 751 | 1,098 | |
Single Male w/Child | 15 | 114 | 141 | |
Single Female w/Child | 190 | 395 | 466 |
Population Change Last Two Decades - Plus Projection
2000 | % | 2010 | % | 2020 | % | 2030 | |
---|---|---|---|---|---|---|---|
Indiana | 6,080,485 | +7 | 6,483,802 | +4 | 6,738,573 | +4 | 7,014,880 |
Whitley County | 30,707 | +8 | 33,292 | +1 | 33,539 | +3 | 34,513 |
Total Working Age Population:
Total Households:
Total Working Age Population:
Total Households:
Total Working Age Population:
Total Households: