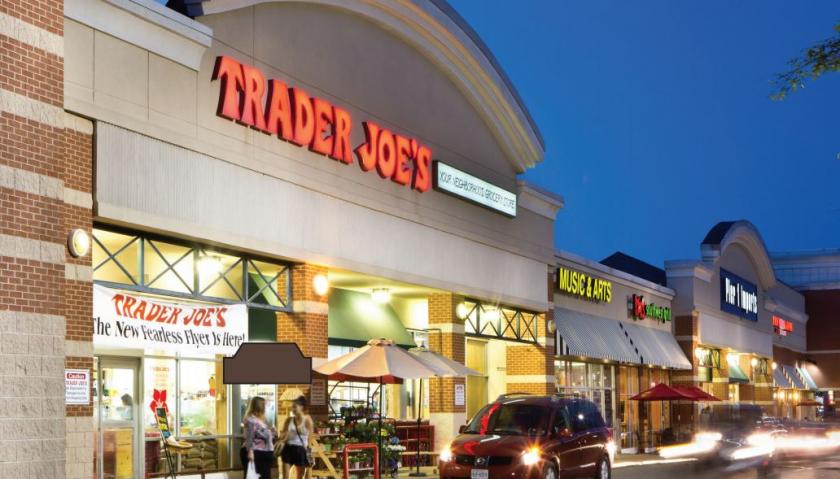
1-Mile | 3-Miles | 5-Miles | ||
---|---|---|---|---|
Total Population | 37,146 | 268,944 | 586,826 | |
Population Median Age | 36 | 37 | 37 | |
Population by Age | 0-9 Yrs | 5652 (15%) | 33590 (12%) | 70629 (12%) |
10-19 Yrs | 4165 (11%) | 24482 (9%) | 54879 (9%) | |
20-29 Yrs | 5310 (14%) | 42866 (15%) | 95906 (16%) | |
30-39 Yrs | 6701 (18%) | 54468 (20%) | 114720 (19%) | |
40-49 Yrs | 5164 (13%) | 38270 (14%) | 83350 (14%) | |
50-59 Yrs | 3936 (10%) | 30578 (11%) | 69888 (11%) | |
60-69 Yrs | 3290 (8%) | 24985 (9%) | 53929 (9%) | |
70+ Yrs | 2929 (7%) | 19705 (7%) | 43523 (7%) | |
Median HH Income | $67,341 | $95,391 | $108,955 | |
Total Household Income | < 24K | 2725 (18%) | 12647 (11%) | 22336 (9%) |
25-49K | 2914 (20%) | 15132 (13%) | 26758 (11%) | |
50-74K | 2460 (16%) | 16605 (14%) | 32021 (13%) | |
75-99K | 1680 (11%) | 14992 (13%) | 30299 (12%) | |
100-199K | 3393 (23%) | 35248 (31%) | 80293 (33%) | |
200K+ | 1329 (9%) | 18603 (16%) | 50246 (20%) | |
Highest Education Level | No Diploma | 5005 | 20219 | 37551 |
Diploma or GED | 4254 | 24707 | 49139 | |
Some College | 3246 | 23565 | 45783 | |
Assoc. Degree | 1671 | 9858 | 19438 | |
Bachelors Degree | 6363 | 59660 | 131699 | |
Higher Degree | 4807 | 57150 | 140587 | |
Total Housing Units | 15,116 | 121,106 | 258,430 | |
--Owner-Occupied | 5,243 | 50,236 | 116,690 | |
--Renter-Occupied | 9,257 | 62,991 | 125,263 | |
Owner-Occupied Values | < 100K | 31 | 394 | 1293 |
100-199K | 688 | 3631 | 5409 | |
200-299K | 1019 | 6147 | 9739 | |
300-399K | 997 | 6592 | 13205 | |
400-499K | 806 | 7529 | 17298 | |
500K+ | 1702 | 25943 | 69747 | |
Total Working Age Population | 29,219 | 220,003 | 482,706 | |
In Work Force | 20,653 | 167,620 | 368,939 | |
Not In Work Force | 8,566 | 52,383 | 113,767 | |
Workforce Employed | 19,508 | 160,127 | 349,828 | |
Workforce Unemployed | 1,006 | 5,396 | 11,953 | |
Civlian Workforce | 20,513 | 165,523 | 361,780 | |
Military Workforce | 140 | 2,097 | 7,159 | |
Total Households | 14,500 | 113,227 | 241,953 | |
Family Households | 7,807 | 57,886 | 127,881 | |
Non-Family Households | 6,692 | 55,341 | 114,072 | |
Married Couple | 5,162 | 42,953 | 98,882 | |
Other Family | 2,646 | 14,933 | 28,999 | |
Married w/Child | 2,681 | 20,674 | 45,222 | |
Single Male w/Child | 267 | 1,357 | 3,009 | |
Single Female w/Child | 1,068 | 5,390 | 10,335 |
Population Change Last Two Decades - Plus Projection
2000 | % | 2010 | % | 2020 | % | 2030 | |
---|---|---|---|---|---|---|---|
District of Columbia | 572,059 | +5 | 601,723 | +21 | 729,501 | +15 | 842,154 |
Maryland | 5,296,486 | +9 | 5,773,552 | +6 | 6,141,900 | +6 | 6,518,750 |
Prince Georges County | 801,515 | +8 | 863,420 | +6 | 916,150 | +4 | 952,950 |
Virginia | 7,078,515 | +13 | 8,001,024 | +8 | 8,655,021 | +8 | 9,331,666 |
Arlington County | 189,453 | +10 | 207,627 | +20 | 249,298 | +10 | 274,339 |
Fairfax County | 969,749 | +12 | 1,081,726 | +7 | 1,162,504 | +7 | 1,244,025 |
Prince William County | 280,813 | +43 | 402,002 | +19 | 478,134 | +20 | 571,844 |
Alexandria city | 128,283 | +9 | 139,966 | +19 | 166,261 | +10 | 182,067 |
Falls Church city | 10,377 | +19 | 12,332 | +22 | 14,988 | +14 | 17,032 |
Total Working Age Population:
Total Households:
Total Working Age Population:
Total Households:
Total Working Age Population:
Total Households: