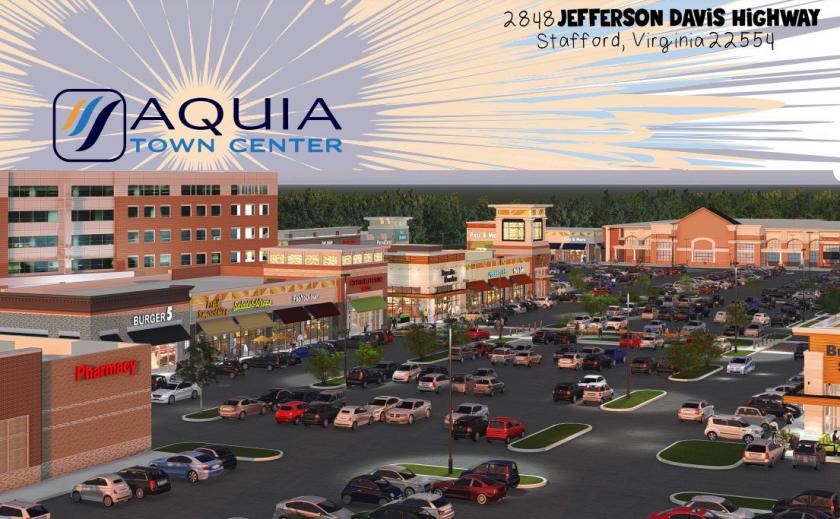
Retail Space
2848 Jefferson Davis Highway Stafford, VA 22554
2848 Jefferson Davis Highway Stafford, VA 22554
Details & Description
Property Highlights
• Located in Stafford County, Virginia, which is consistently ranked in the top 10 most wealthy counties in the USA
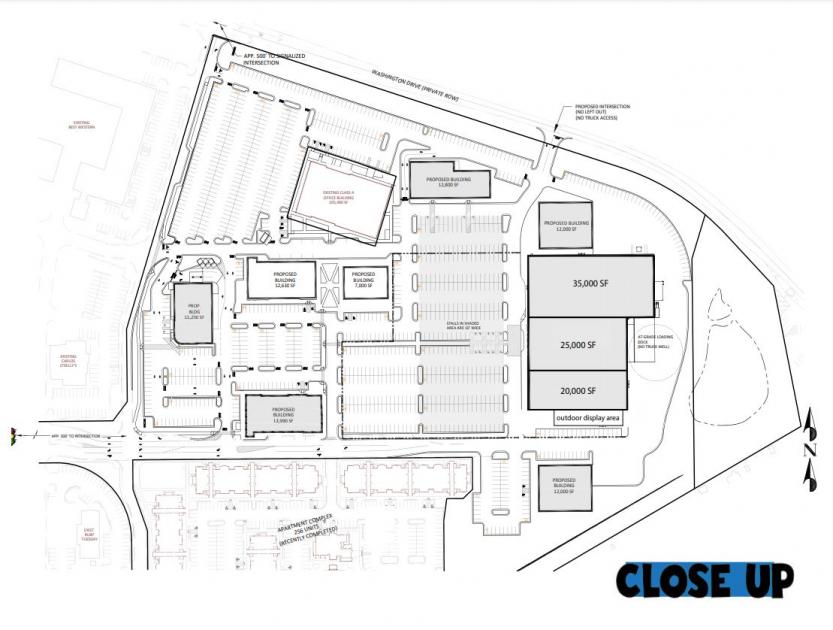
• Seeking Up To 200,000 SF Anchor Tenant or Several Junior Anchors
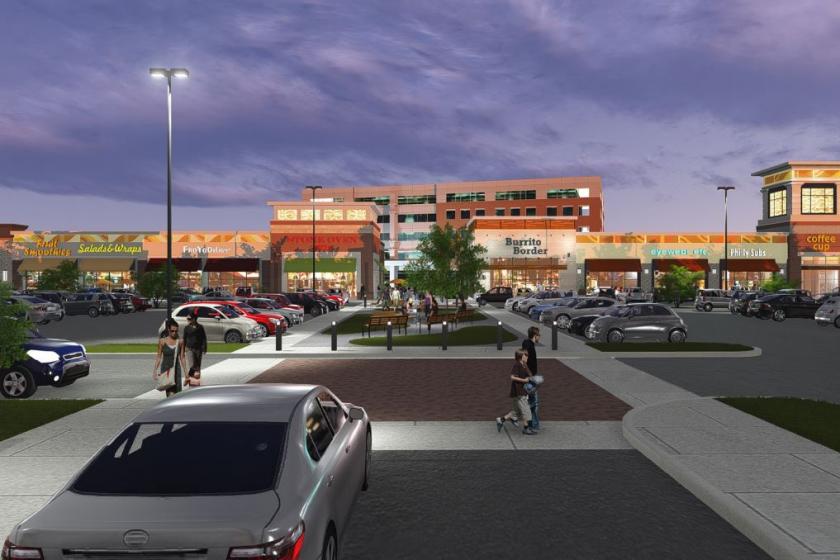
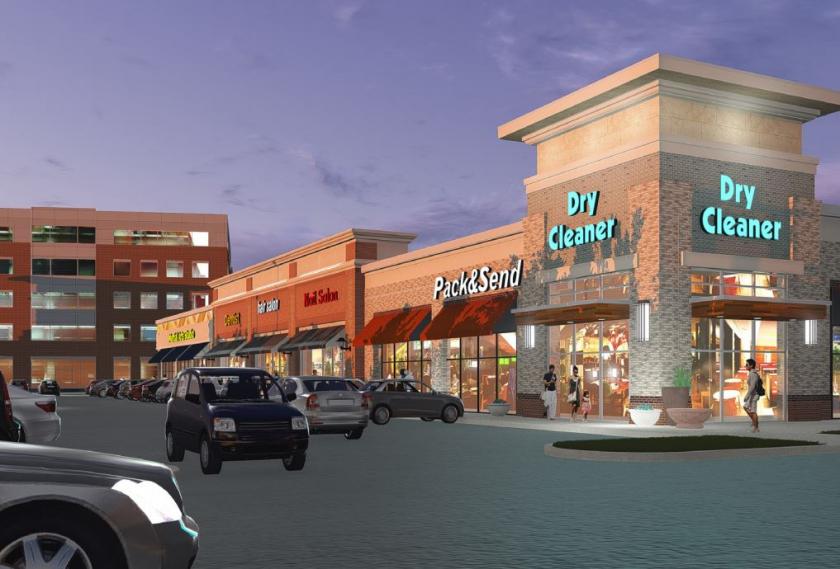
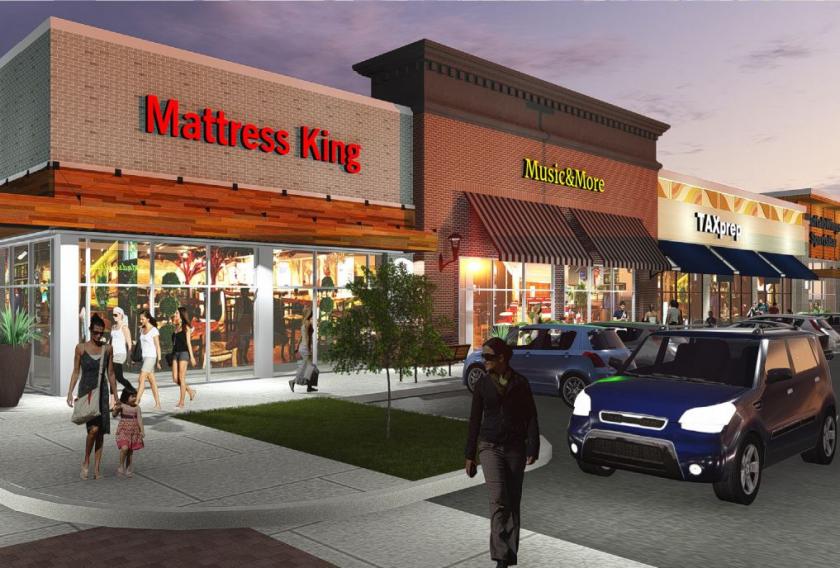
Additional Photos
Listing Agents

Evan Albert
O: 410-308-0700
evan@mfirealty.com
O: 410-308-0700
evan@mfirealty.com
While we strive to provide the most accurate information, all listing information, and demographic data, is provided by third-parties. As such, MyEListing will not be responsible for the accuracy of the information. It is strongly recommended that you verify all information with the listing agent, and any relevant agencies, prior to making any decisions.


