Retail Space
7090 Deepage Drive Columbia, MD 21045
7090 Deepage Drive Columbia, MD 21045
Details & Description
Property Highlights
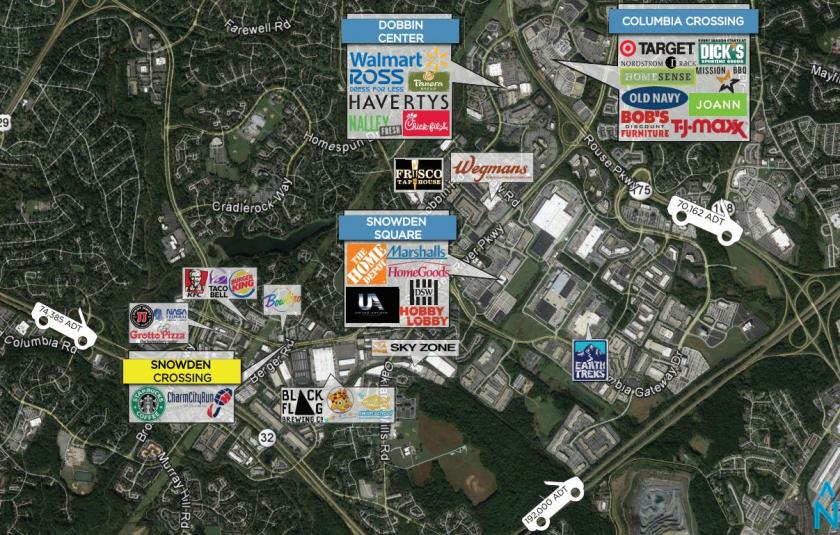
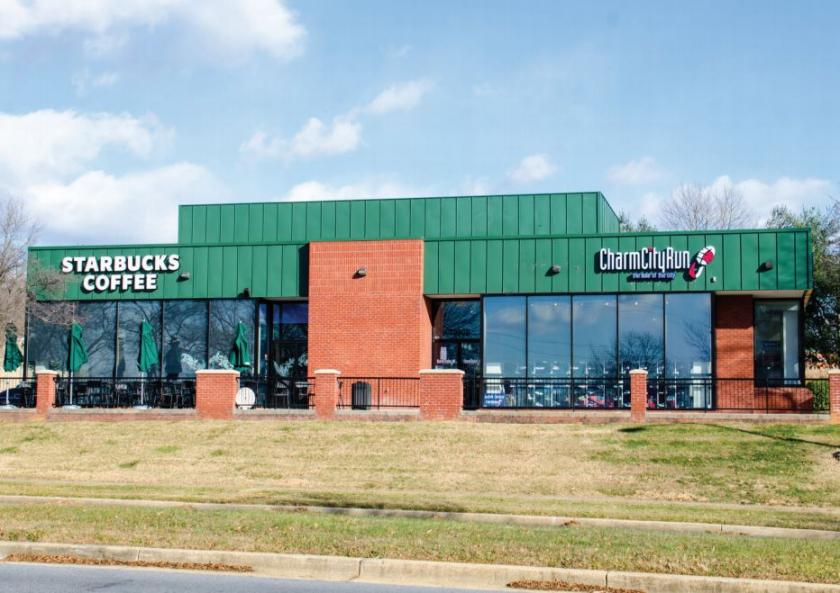
• Property fronts Snowden River Parkway
• 40,000 - cars passing the site daily
Listing Agents

Evan Albert
O: 410-308-0700
evan@mfirealty.com
O: 410-308-0700
evan@mfirealty.com
While we strive to provide the most accurate information, all listing information, and demographic data, is provided by third-parties. As such, MyEListing will not be responsible for the accuracy of the information. It is strongly recommended that you verify all information with the listing agent, and any relevant agencies, prior to making any decisions.