Retail Space
7025 Berry Road Accokeek, MD 20607
7025 Berry Road Accokeek, MD 20607

Details & Description
Property Highlights
- • 2,000 SF available for lease
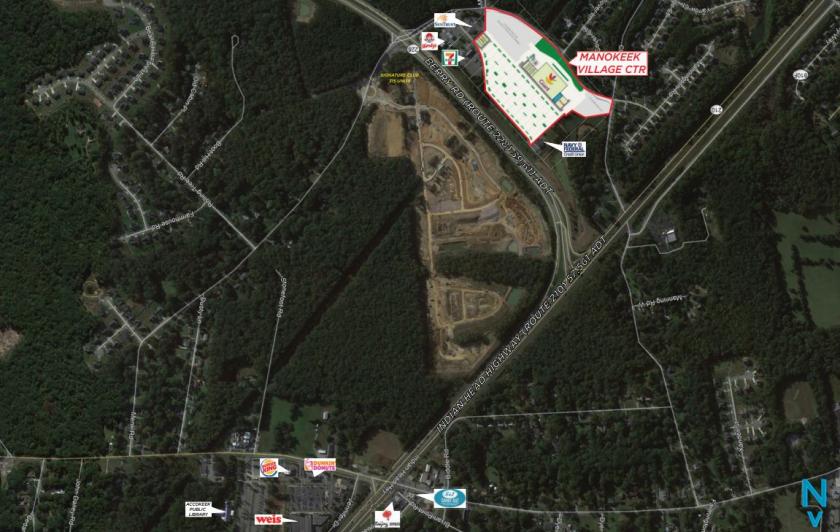
- • Excellent visibility from Indian Head Highway
- • Mixed-use center with an abundance of parking
- • Over 57,000 cars passing the site daily
Listing Agents

Evan Albert
O: 410-308-0700
evan@mfirealty.com
O: 410-308-0700
evan@mfirealty.com
While we strive to provide the most accurate information, all listing information, and demographic data, is provided by third-parties. As such, MyEListing will not be responsible for the accuracy of the information. It is strongly recommended that you verify all information with the listing agent, and any relevant agencies, prior to making any decisions.