Retail Space
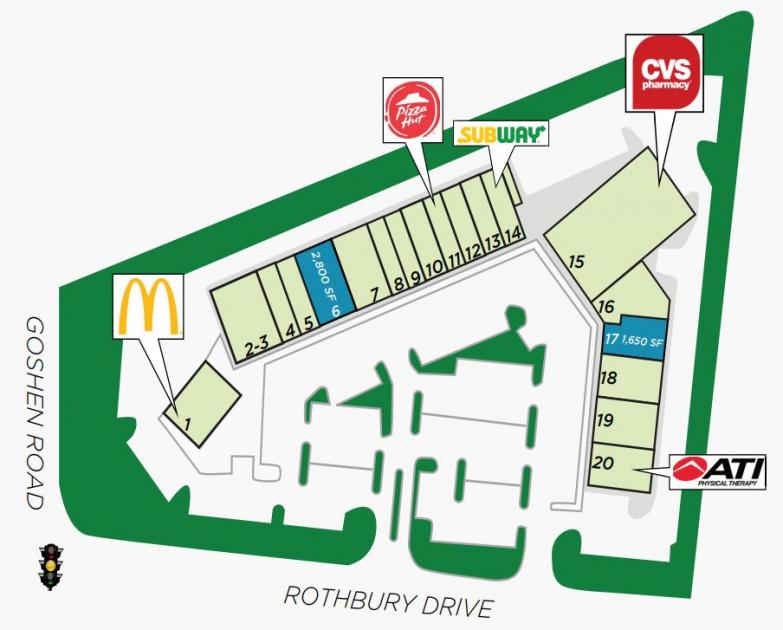
9140 Rothbury Drive Gaithersburg, MD 20879
9140 Rothbury Drive Gaithersburg, MD 20879
Details & Description
Property Highlights
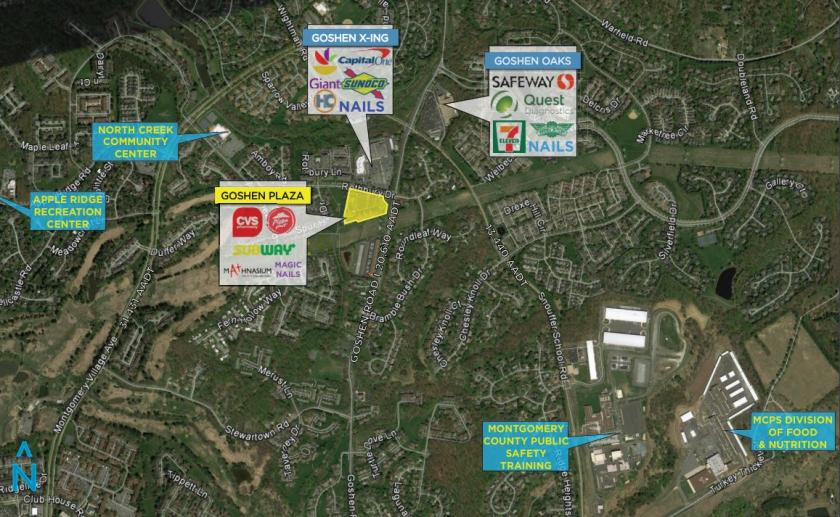
• Site sits in the middle of the Goshen area neighborhoods retail
• Retail space for lease in Montgomery Village in Gaithersburg
Listing Agents

Evan Albert
O: 410-308-0700
evan@mfirealty.com
O: 410-308-0700
evan@mfirealty.com
While we strive to provide the most accurate information, all listing information, and demographic data, is provided by third-parties. As such, MyEListing will not be responsible for the accuracy of the information. It is strongly recommended that you verify all information with the listing agent, and any relevant agencies, prior to making any decisions.