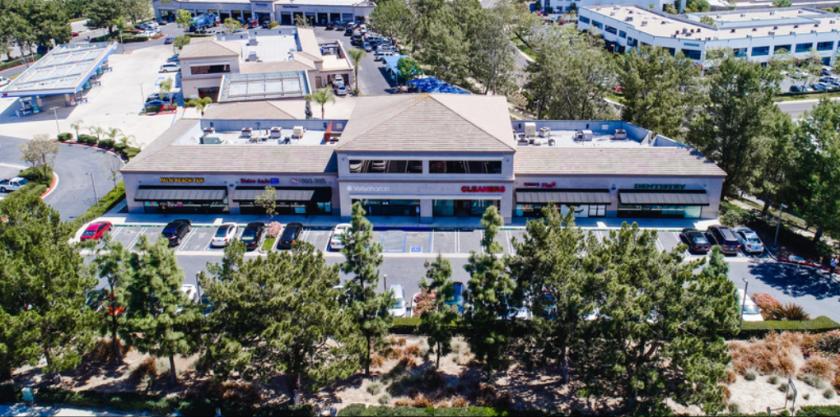
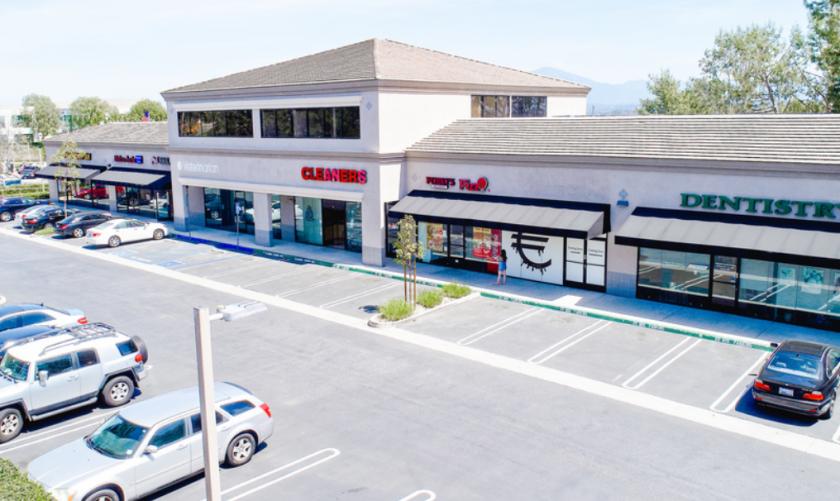
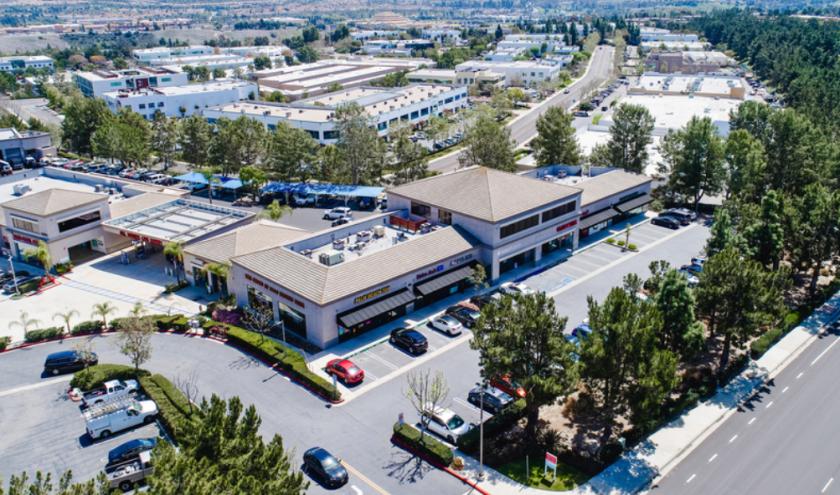
1-Mile | 3-Miles | 5-Miles | ||
---|---|---|---|---|
Total Population | 22,709 | 114,124 | 274,631 | |
Population Median Age | 36 | 42 | 43 | |
Population by Age | 0-9 Yrs | 3095 (13%) | 12374 (10%) | 28852 (10%) |
10-19 Yrs | 2911 (12%) | 12717 (11%) | 30580 (11%) | |
20-29 Yrs | 3024 (13%) | 11859 (10%) | 30643 (11%) | |
30-39 Yrs | 3555 (15%) | 13939 (12%) | 32639 (11%) | |
40-49 Yrs | 3904 (17%) | 15680 (13%) | 35775 (13%) | |
50-59 Yrs | 3448 (15%) | 17305 (15%) | 41110 (14%) | |
60-69 Yrs | 1793 (7%) | 14048 (12%) | 35410 (12%) | |
70+ Yrs | 979 (4%) | 16202 (14%) | 39622 (14%) | |
Median HH Income | $111,120 | $99,641 | $102,129 | |
Total Household Income | < 24K | 749 (8%) | 5892 (12%) | 12297 (11%) |
25-49K | 979 (11%) | 5754 (12%) | 13920 (13%) | |
50-74K | 894 (10%) | 5946 (13%) | 13608 (12%) | |
75-99K | 1118 (13%) | 5231 (11%) | 12090 (11%) | |
100-199K | 3676 (42%) | 14274 (31%) | 31996 (30%) | |
200K+ | 1180 (13%) | 8400 (18%) | 21706 (20%) | |
Highest Education Level | No Diploma | 422 | 3632 | 12345 |
Diploma or GED | 1657 | 9938 | 25237 | |
Some College | 3656 | 16721 | 39920 | |
Assoc. Degree | 1223 | 6995 | 17320 | |
Bachelors Degree | 5813 | 28442 | 65904 | |
Higher Degree | 2710 | 17399 | 40118 | |
Total Housing Units | 9,034 | 49,291 | 116,246 | |
--Owner-Occupied | 4,348 | 30,487 | 70,651 | |
--Renter-Occupied | 4,248 | 15,011 | 34,966 | |
Owner-Occupied Values | < 100K | 36 | 499 | 1742 |
100-199K | 21 | 1301 | 2229 | |
200-299K | 69 | 2292 | 3682 | |
300-399K | 308 | 2978 | 5041 | |
400-499K | 781 | 3220 | 5851 | |
500K+ | 3134 | 20195 | 52106 | |
Total Working Age Population | 17,836 | 93,796 | 226,928 | |
In Work Force | 13,773 | 60,328 | 145,042 | |
Not In Work Force | 4,063 | 33,467 | 81,886 | |
Workforce Employed | 13,174 | 57,826 | 138,601 | |
Workforce Unemployed | 587 | 2,472 | 6,368 | |
Civlian Workforce | 13,761 | 60,298 | 144,969 | |
Military Workforce | 12 | 30 | 73 | |
Total Households | 8,596 | 45,498 | 105,617 | |
Family Households | 5,760 | 29,339 | 70,012 | |
Non-Family Households | 2,836 | 16,159 | 35,605 | |
Married Couple | 4,362 | 23,953 | 57,155 | |
Other Family | 1,397 | 5,385 | 12,857 | |
Married w/Child | 2,511 | 9,876 | 21,830 | |
Single Male w/Child | 226 | 655 | 1,719 | |
Single Female w/Child | 357 | 1,444 | 3,737 |
Population Change Last Two Decades - Plus Projection
2000 | % | 2010 | % | 2020 | % | 2030 | |
---|---|---|---|---|---|---|---|
California | 33,871,648 | +10 | 37,253,956 | +9 | 40,467,295 | +8 | 43,631,295 |
Los Angeles County | 9,519,338 | +3 | 9,818,605 | +6 | 10,369,367 | +4 | 10,759,850 |
Orange County | 2,846,289 | +6 | 3,010,232 | +8 | 3,257,087 | +5 | 3,431,096 |
Riverside County | 1,545,387 | +42 | 2,189,641 | +14 | 2,493,116 | +14 | 2,843,493 |
Total Working Age Population:
Total Households:
Total Working Age Population:
Total Households:
Total Working Age Population:
Total Households: