Office Space
1508 Dessau Ridge Lane Austin, TX 78754
1508 Dessau Ridge Lane Austin, TX 78754
Details & Description
Property Highlights
- • SUBLEASE - AVAILABLE NOW
- • Private Break Area
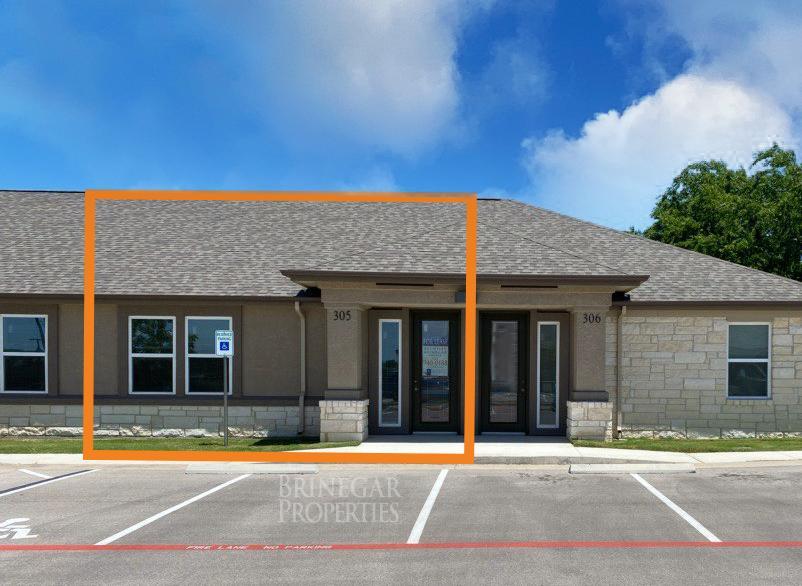
- • Natural Lighting
Additional Photos


Listing Agents

Daniel Reuter
O: 512-940-0188
M: 512-689-0251
daniel@512texas.com
O: 512-940-0188
M: 512-689-0251
daniel@512texas.com
While we strive to provide the most accurate information, all listing information, and demographic data, is provided by third-parties. As such, MyEListing will not be responsible for the accuracy of the information. It is strongly recommended that you verify all information with the listing agent, and any relevant agencies, prior to making any decisions.


