Office Space
6 West Main Street Honeoye Falls, NY 14472
6 West Main Street Honeoye Falls, NY 14472
Details & Description
Property Highlights
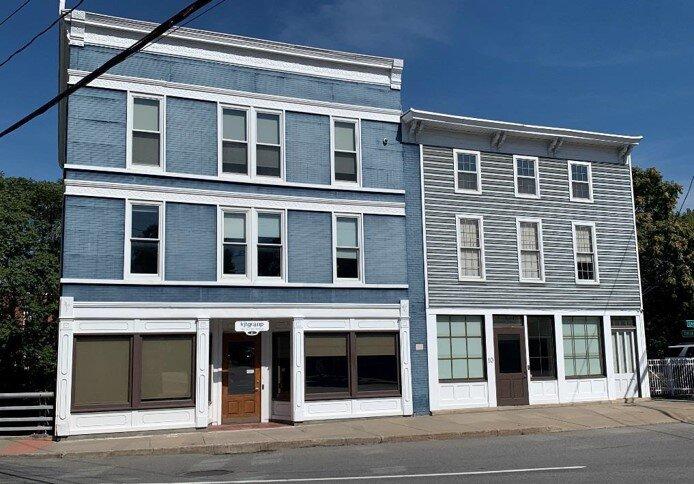
• For Sale seven 7 buildings on five 5 adjacent parcels located on East Street in the Village of Honeoye Falls
• 6 10 East Street are connected office buildings are currently fully leased.
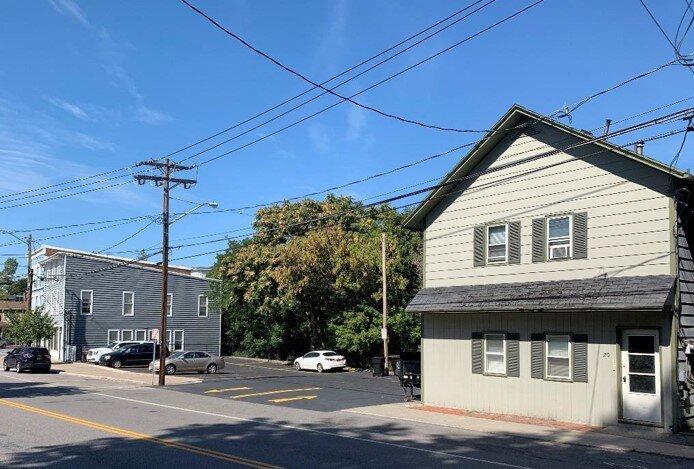
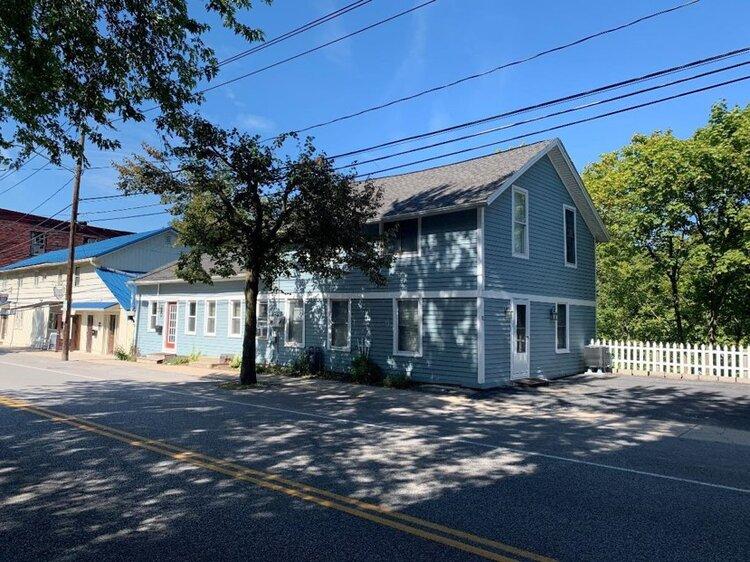
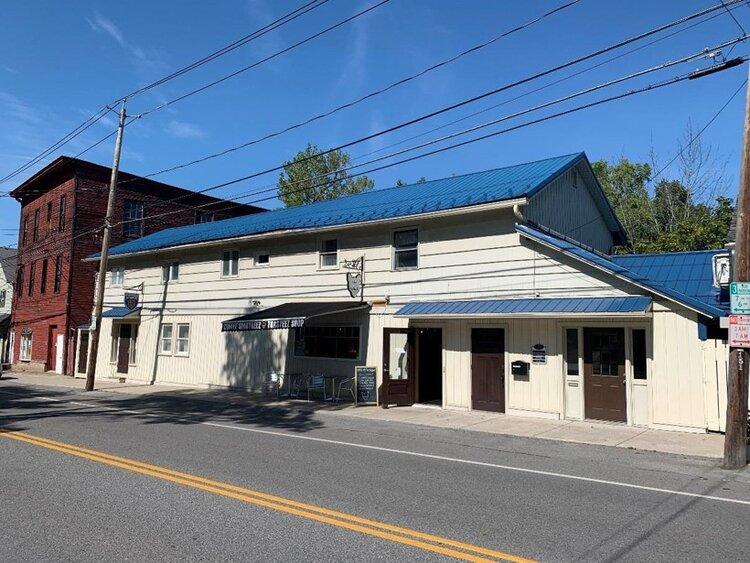
Additional Photos
Listing Agents

Jacob Rivera
O: 585-454-4500
M: 310-650-4333
jrivera@caliberbrokerage.com
O: 585-454-4500
M: 310-650-4333
jrivera@caliberbrokerage.com
While we strive to provide the most accurate information, all listing information, and demographic data, is provided by third-parties. As such, MyEListing will not be responsible for the accuracy of the information. It is strongly recommended that you verify all information with the listing agent, and any relevant agencies, prior to making any decisions.


