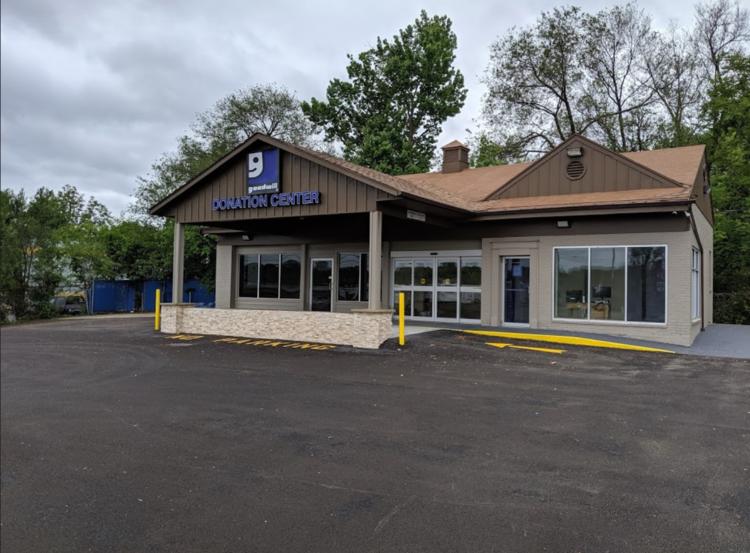
Retail Space
3511 Brewerton Road Syracuse, NY 13212
3511 Brewerton Road Syracuse, NY 13212
Details & Description
Property Highlights
- • FORMER GOODWILL DONATION CENTER
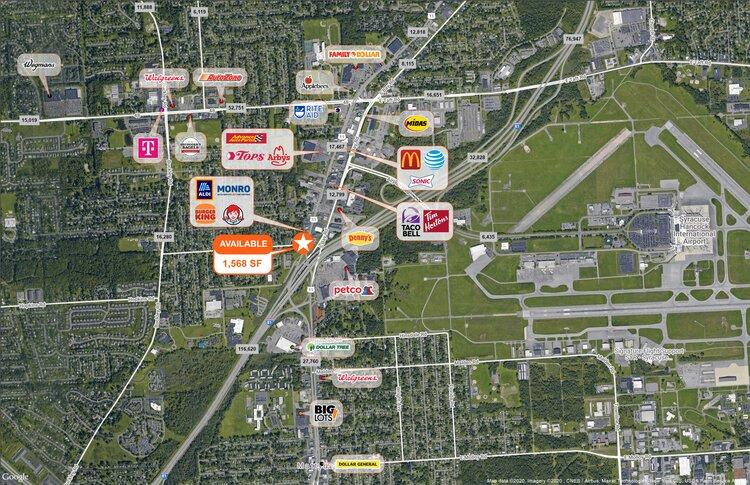
- • HIGHLY VISIBLE ALONG BREWERTON RD 17,500 VPD
- • EASY ACCESS TO I-81
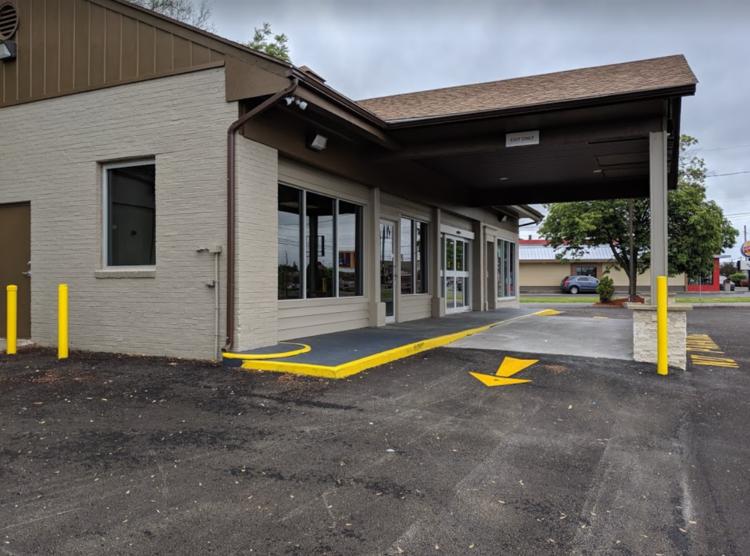
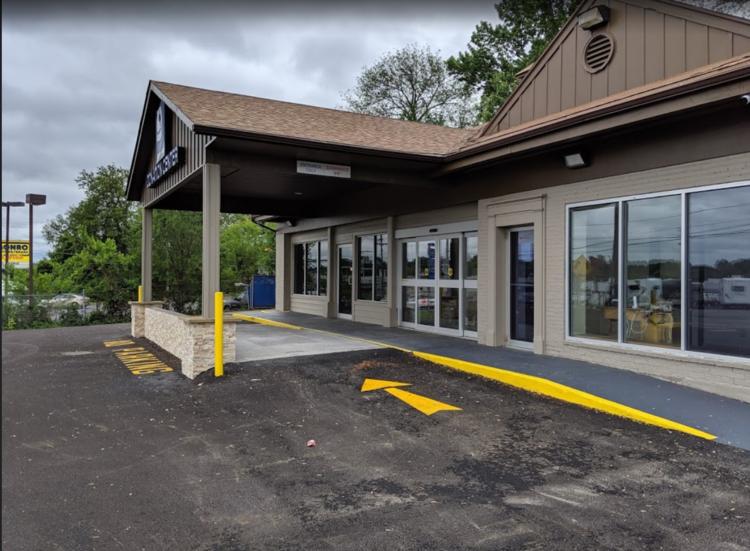
Additional Photos
Listing Agents

Jacob Rivera
O: 585-454-4500
M: 310-650-4333
jrivera@caliberbrokerage.com
O: 585-454-4500
M: 310-650-4333
jrivera@caliberbrokerage.com
While we strive to provide the most accurate information, all listing information, and demographic data, is provided by third-parties. As such, MyEListing will not be responsible for the accuracy of the information. It is strongly recommended that you verify all information with the listing agent, and any relevant agencies, prior to making any decisions.


