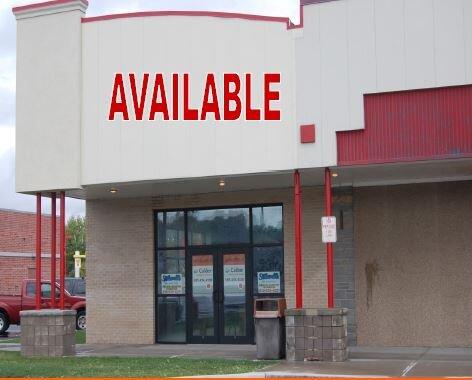
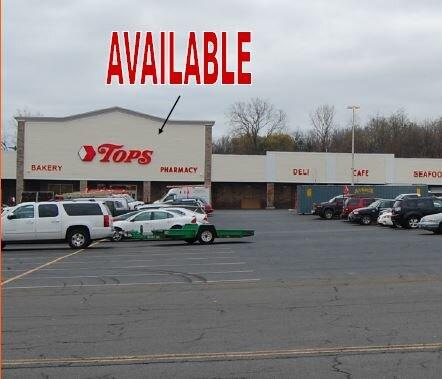
Retail Space
389 Hamilton Street Geneva, NY 14456
389 Hamilton Street Geneva, NY 14456
Details & Description
Property Highlights
- • 1,578 SF Available
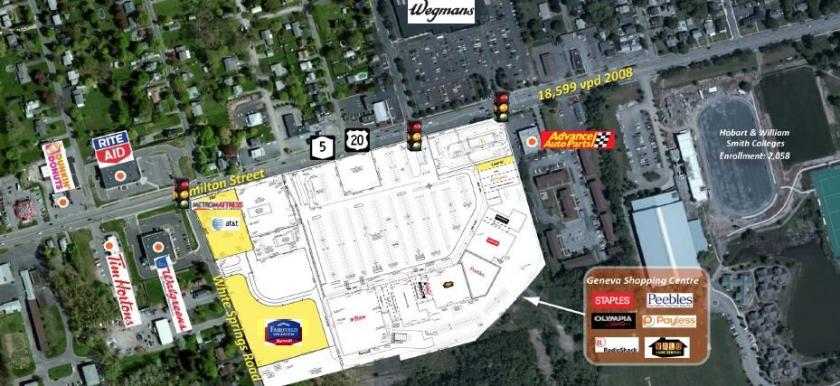
- • Close to Hobart William Smith Colleges
- • 16,995 vehicles per day in front of site
Listing Agents

Adam Pancione
O: 585-454-4500
apancione@caliberbrokerage.com
O: 585-454-4500
apancione@caliberbrokerage.com
While we strive to provide the most accurate information, all listing information, and demographic data, is provided by third-parties. As such, MyEListing will not be responsible for the accuracy of the information. It is strongly recommended that you verify all information with the listing agent, and any relevant agencies, prior to making any decisions.