Office Space
520 Livingston Avenue Albany, NY 12206
520 Livingston Avenue Albany, NY 12206

Details & Description
Property Highlights
• CONVENIENT ENTRANCE AND PARKING FOR CLIENTS CUSTOMERS OFF OF LIVINGSTON AVENUE
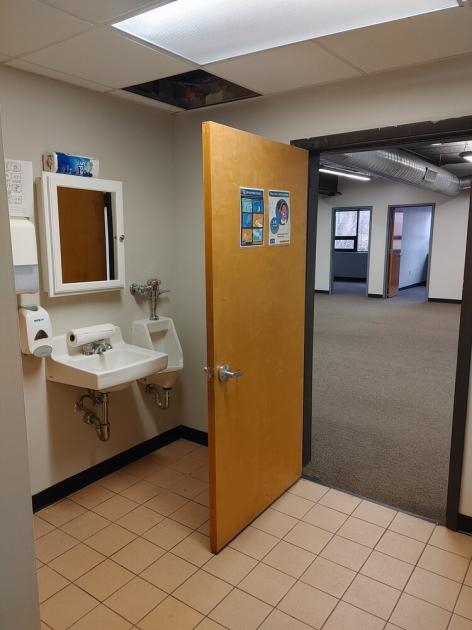
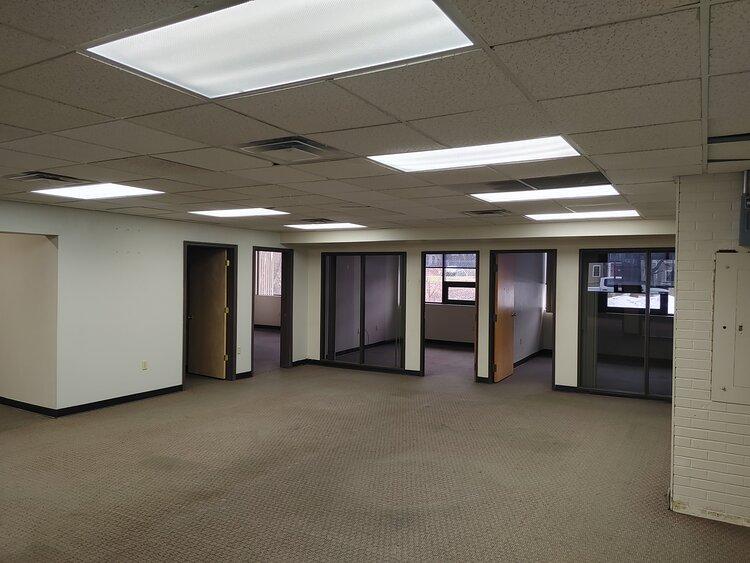
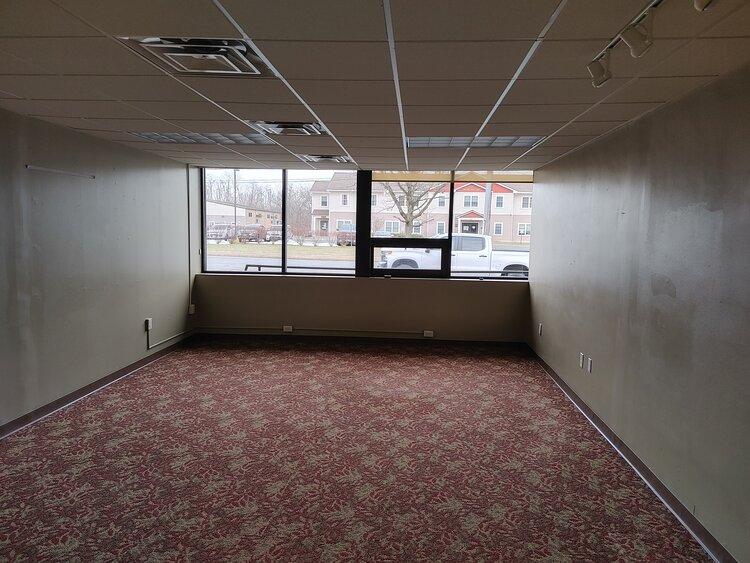
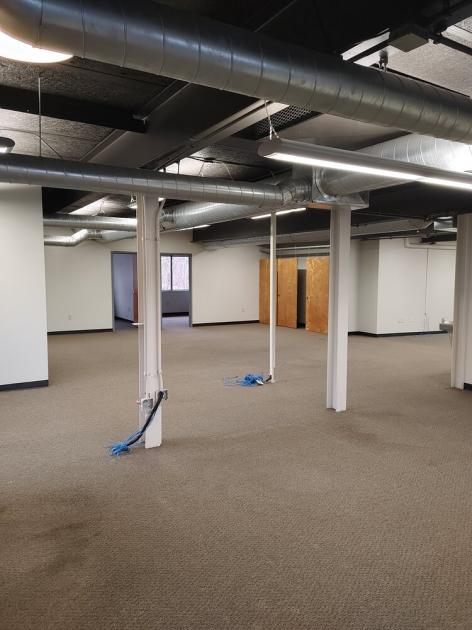
• 12 OFFICE SUITES, 1 CONFERENCE ROOM, LARGE COMMON AREA, KITCHENETTE
Additional Photos
Listing Agents

Adam Pancione
O: 585-454-4500
apancione@caliberbrokerage.com
O: 585-454-4500
apancione@caliberbrokerage.com
While we strive to provide the most accurate information, all listing information, and demographic data, is provided by third-parties. As such, MyEListing will not be responsible for the accuracy of the information. It is strongly recommended that you verify all information with the listing agent, and any relevant agencies, prior to making any decisions.


