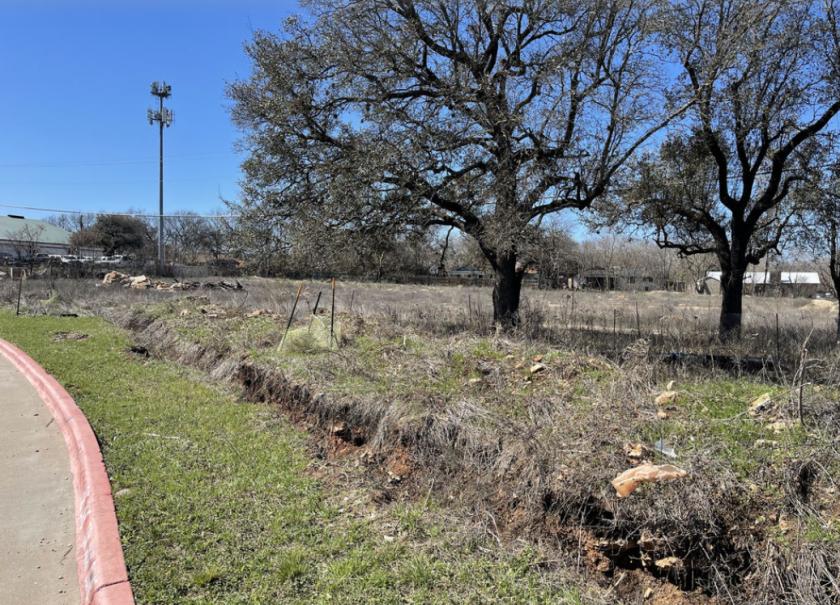
Commercial Land
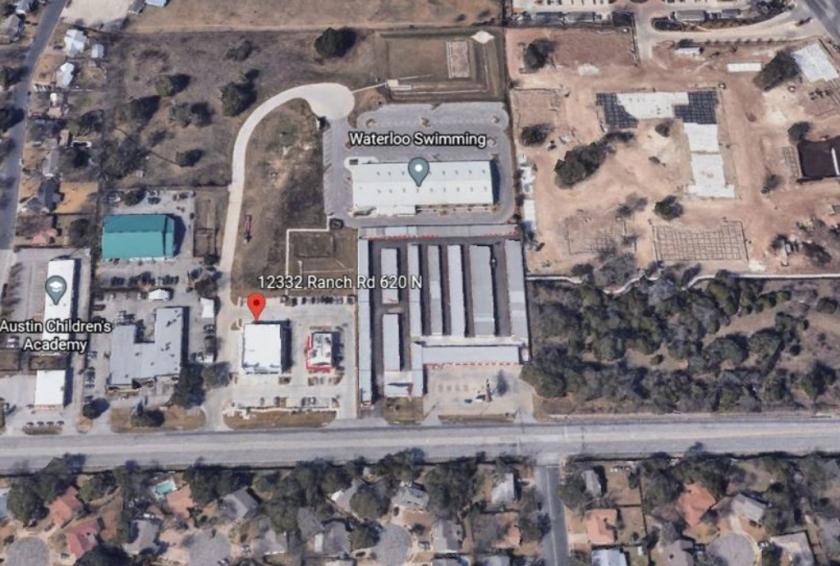
12332 Ranch Road 620 Austin, TX 78750
12332 Ranch Road 620 Austin, TX 78750
Details & Description
Property Highlights
- • For Sale or Joint Venture With Developer
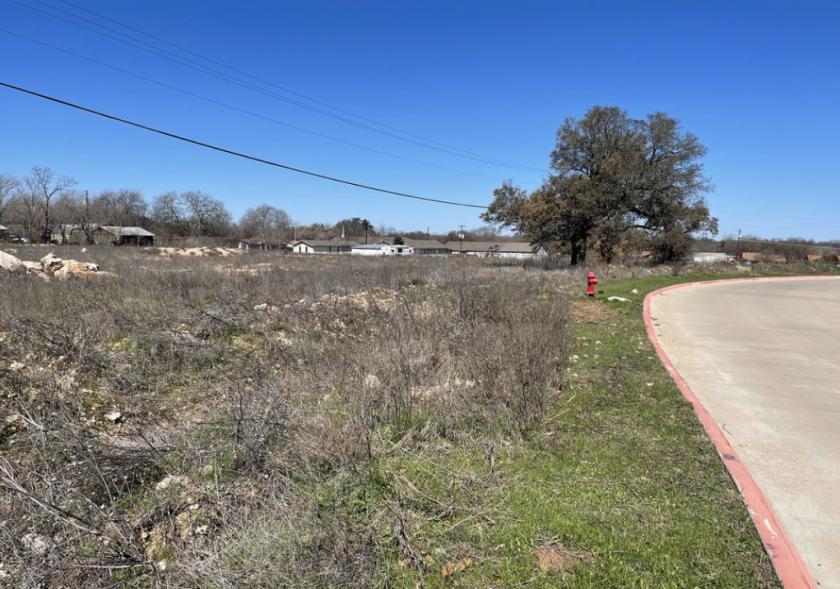
- • All Utilities On-Site
- • Platting, Site Plan, and Building Permits Approved
- • 3.96 Acres
- • Zoned General Business City of Cedar Park
Listing Agents

Robert Creamer
O: 214-564-8909
robert.creamer@expcommercial.com
O: 214-564-8909
robert.creamer@expcommercial.com
While we strive to provide the most accurate information, all listing information, and demographic data, is provided by third-parties. As such, MyEListing will not be responsible for the accuracy of the information. It is strongly recommended that you verify all information with the listing agent, and any relevant agencies, prior to making any decisions.