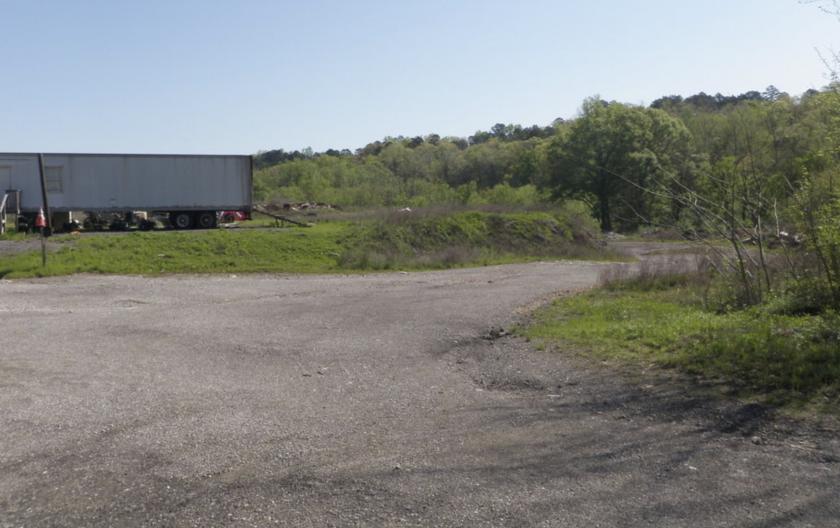
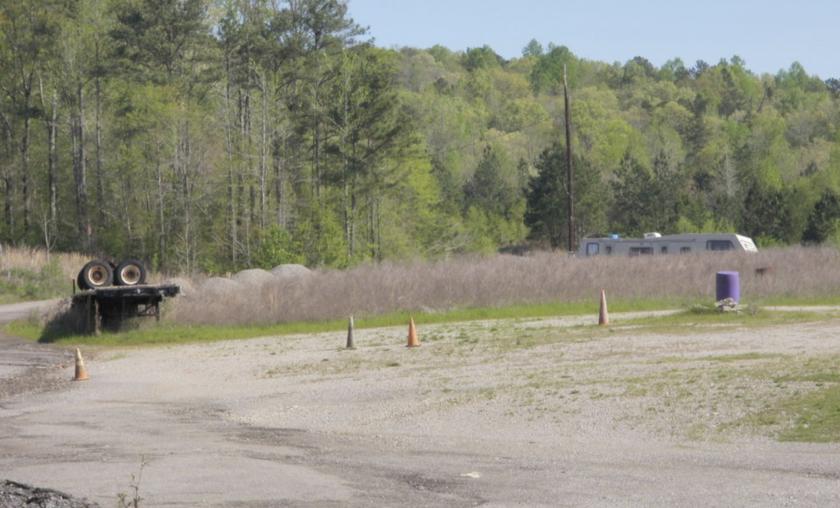
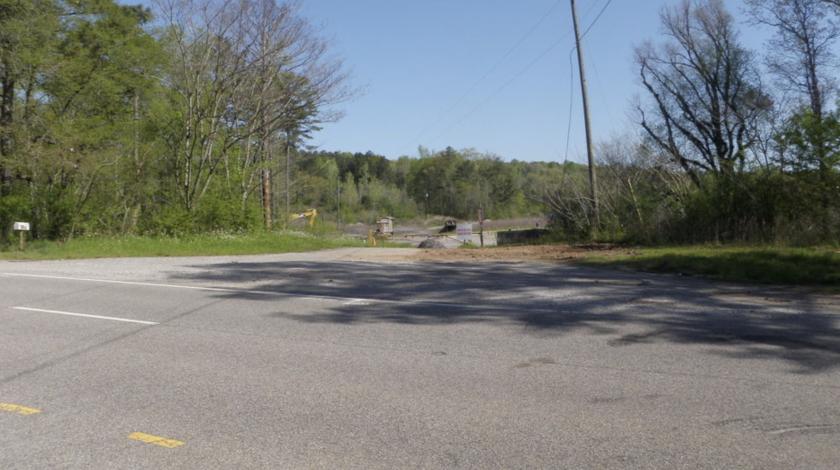
1-Mile | 3-Miles | 5-Miles | ||
---|---|---|---|---|
Total Population | 1,082 | 8,607 | 43,514 | |
Population Median Age | 38 | 39 | 39 | |
Population by Age | 0-9 Yrs | 130 (12%) | 1065 (12%) | 5934 (13%) |
10-19 Yrs | 188 (17%) | 1134 (13%) | 5817 (13%) | |
20-29 Yrs | 86 (7%) | 849 (9%) | 4258 (9%) | |
30-39 Yrs | 203 (18%) | 1445 (16%) | 6170 (14%) | |
40-49 Yrs | 116 (10%) | 1127 (13%) | 5992 (13%) | |
50-59 Yrs | 130 (12%) | 945 (10%) | 5553 (12%) | |
60-69 Yrs | 119 (10%) | 1028 (11%) | 5014 (11%) | |
70+ Yrs | 111 (10%) | 1015 (11%) | 4775 (10%) | |
Median HH Income | $61,364 | $67,683 | $66,505 | |
Total Household Income | < 24K | 68 (18%) | 476 (14%) | 2804 (16%) |
25-49K | 103 (27%) | 783 (24%) | 3505 (20%) | |
50-74K | 52 (13%) | 484 (14%) | 2902 (17%) | |
75-99K | 64 (17%) | 572 (17%) | 2648 (15%) | |
100-199K | 60 (16%) | 714 (22%) | 3668 (21%) | |
200K+ | 24 (6%) | 199 (6%) | 1186 (7%) | |
Highest Education Level | No Diploma | 128 | 626 | 2543 |
Diploma or GED | 206 | 1620 | 7167 | |
Some College | 99 | 1146 | 6325 | |
Assoc. Degree | 79 | 671 | 2943 | |
Bachelors Degree | 178 | 1321 | 6817 | |
Higher Degree | 58 | 664 | 4157 | |
Total Housing Units | 394 | 3,547 | 18,630 | |
--Owner-Occupied | 285 | 2,761 | 12,730 | |
--Renter-Occupied | 86 | 466 | 3,982 | |
Owner-Occupied Values | < 100K | 79 | 527 | 2825 |
100-199K | 107 | 1090 | 5007 | |
200-299K | 57 | 733 | 2568 | |
300-399K | 27 | 236 | 1008 | |
400-499K | 7 | 72 | 483 | |
500K+ | 8 | 103 | 839 | |
Total Working Age Population | 813 | 6,719 | 33,613 | |
In Work Force | 518 | 4,140 | 21,465 | |
Not In Work Force | 295 | 2,579 | 12,147 | |
Workforce Employed | 509 | 4,007 | 20,378 | |
Workforce Unemployed | 9 | 133 | 1,041 | |
Civlian Workforce | 518 | 4,140 | 21,419 | |
Military Workforce | 0 | 0 | 47 | |
Total Households | 372 | 3,227 | 16,712 | |
Family Households | 244 | 2,193 | 10,990 | |
Non-Family Households | 127 | 1,034 | 5,722 | |
Married Couple | 183 | 1,725 | 8,117 | |
Other Family | 61 | 467 | 2,873 | |
Married w/Child | 64 | 654 | 3,363 | |
Single Male w/Child | 0 | 22 | 159 | |
Single Female w/Child | 22 | 167 | 1,177 |
Population Change Last Two Decades - Plus Projection
2000 | % | 2010 | % | 2020 | % | 2030 | |
---|---|---|---|---|---|---|---|
Alabama | 4,447,100 | +7 | 4,779,736 | +3 | 4,940,253 | +4 | 5,124,380 |
Jefferson County | 662,047 | -1 | 658,466 | +1 | 662,458 | 0 | 665,244 |
St. Clair County | 64,742 | +29 | 83,593 | +8 | 90,634 | +11 | 100,206 |
Shelby County | 143,293 | +36 | 195,085 | +15 | 224,628 | +13 | 253,485 |
Total Working Age Population:
Total Households:
Total Working Age Population:
Total Households:
Total Working Age Population:
Total Households: