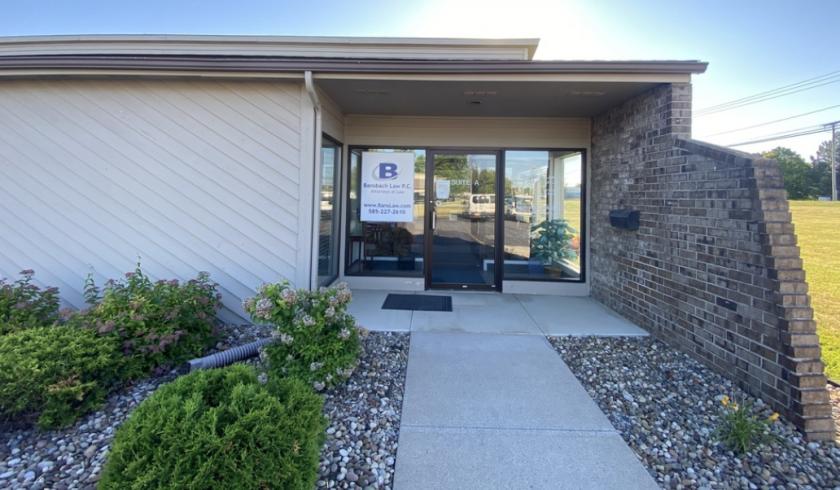
Office Space
31 Erie Canal Drive Rochester, NY 14626
31 Erie Canal Drive Rochester, NY 14626
Details & Description
Property Highlights
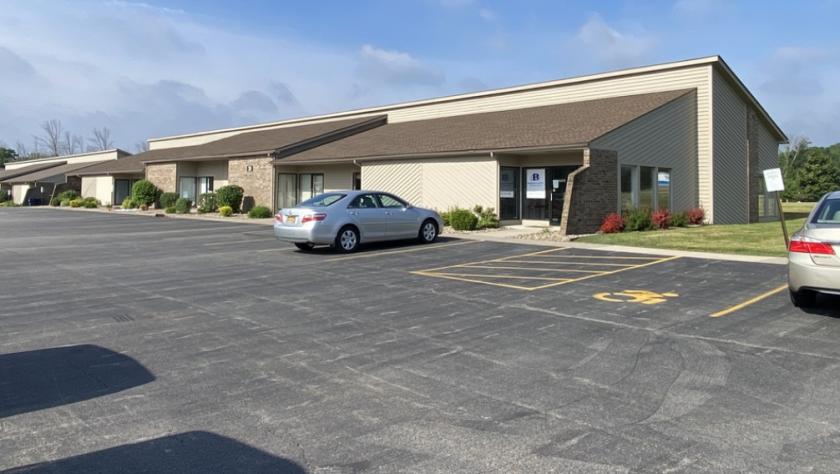
- • Walking distance to Unity Hospital
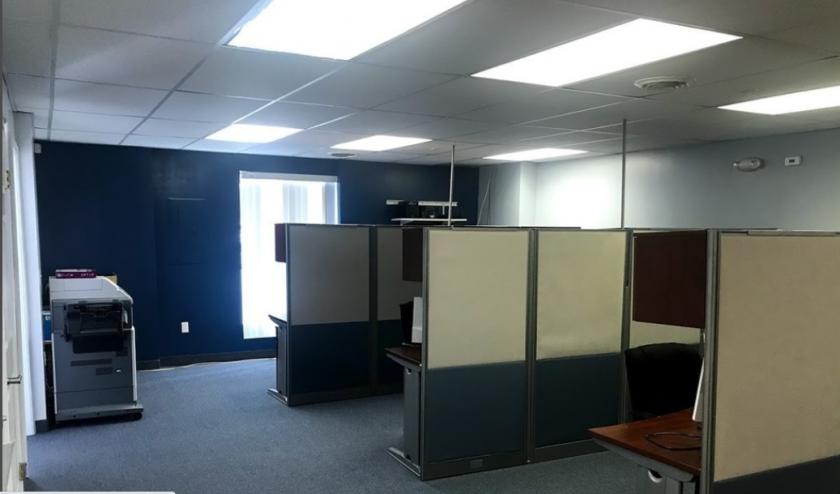
- • Space is in Excellent Condition
- • Fully Built Out as Standard Office
Listing Agents

Michael Conroy
EXP Commercial New York
O: 585-735-7739
M: 585-802-3327
michaelconroyrealty@gmail.com
EXP Commercial New York
O: 585-735-7739
M: 585-802-3327
michaelconroyrealty@gmail.com

Richard Rock
EXP Commercial
O: 585-217-7800
M: 585-217-7800
richard.rock7800@gmail.com
EXP Commercial
O: 585-217-7800
M: 585-217-7800
richard.rock7800@gmail.com
While we strive to provide the most accurate information, all listing information, and demographic data, is provided by third-parties. As such, MyEListing will not be responsible for the accuracy of the information. It is strongly recommended that you verify all information with the listing agent, and any relevant agencies, prior to making any decisions.