Specialty Real Estate
1831 Falls of Rough Road Caneyville, KY 42721
1831 Falls of Rough Road Caneyville, KY 42721
Details & Description
Property Highlights
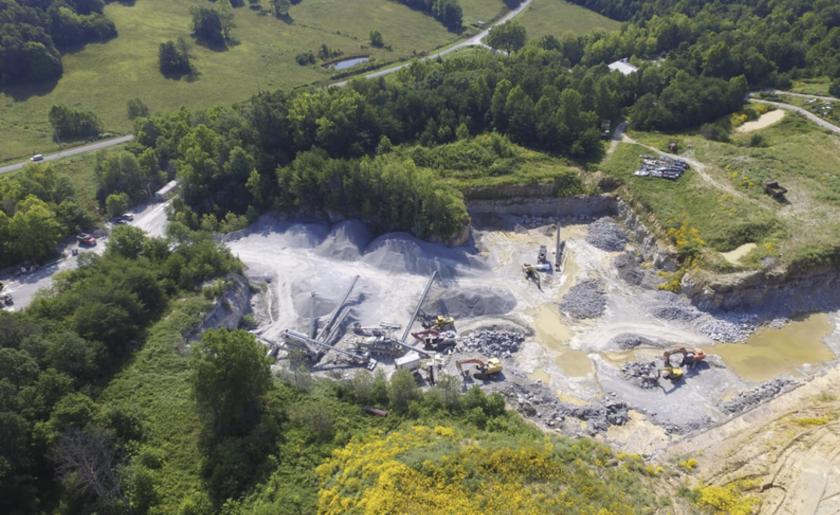
- • Real estate included
- • Business and equipment included
- • Producing rock quarry
- • Established clientele
- • Family owned
Additional Photos


Listing Agents

Stephanie Gilezan
O: 502-640-3622
commercial@gilezanteam.com
O: 502-640-3622
commercial@gilezanteam.com
While we strive to provide the most accurate information, all listing information, and demographic data, is provided by third-parties. As such, MyEListing will not be responsible for the accuracy of the information. It is strongly recommended that you verify all information with the listing agent, and any relevant agencies, prior to making any decisions.


