Industrial Properties
7760 U.S. 84 Mansfield, LA 71052
7760 U.S. 84 Mansfield, LA 71052

Details & Description
Property Highlights
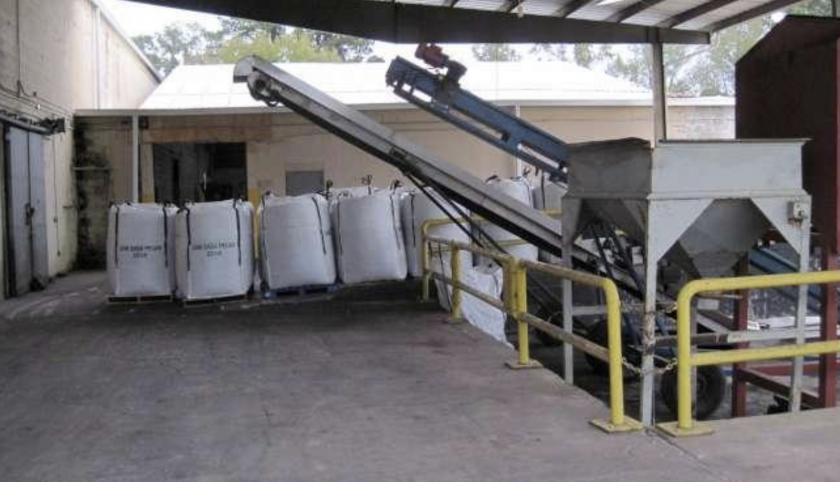
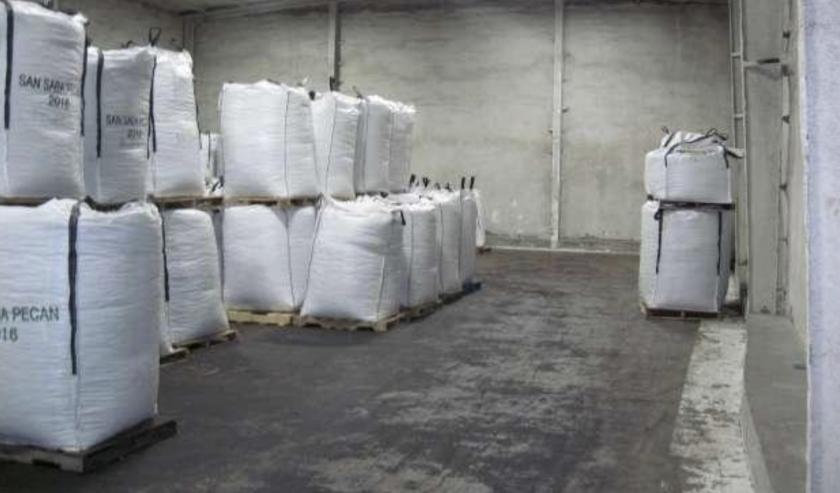
• Building 2 - Approximately 13,233 SF of metal warehouse space available. Approximately 18 Feet of Clear Height.
• Building 1 - Approximately 18,244 SF of concrete warehouse space available. 12 - 20 Feet of Clear Height.
Listing Agents

Doug Abington
O: 318-572-1568
M: 318-698-1114
douga@sealynet.com
O: 318-572-1568
M: 318-698-1114
douga@sealynet.com
While we strive to provide the most accurate information, all listing information, and demographic data, is provided by third-parties. As such, MyEListing will not be responsible for the accuracy of the information. It is strongly recommended that you verify all information with the listing agent, and any relevant agencies, prior to making any decisions.