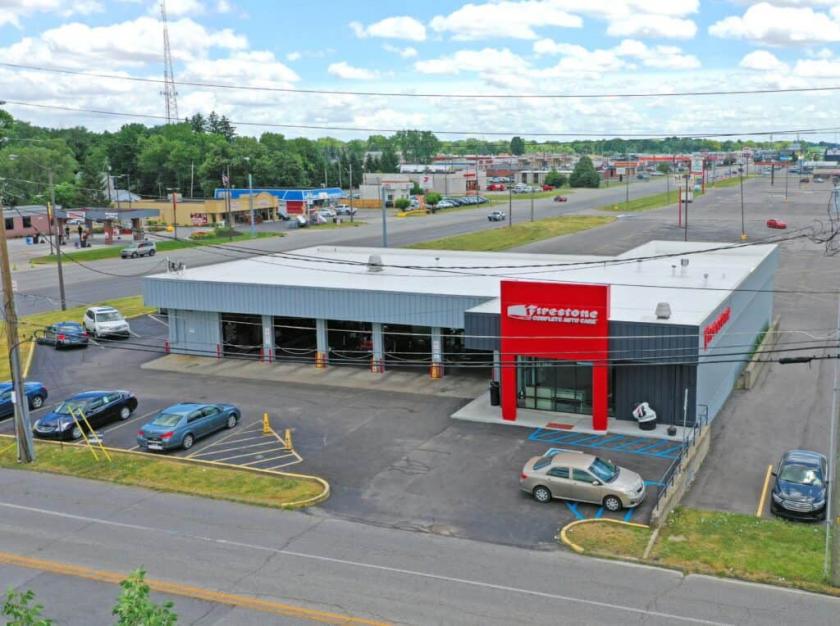
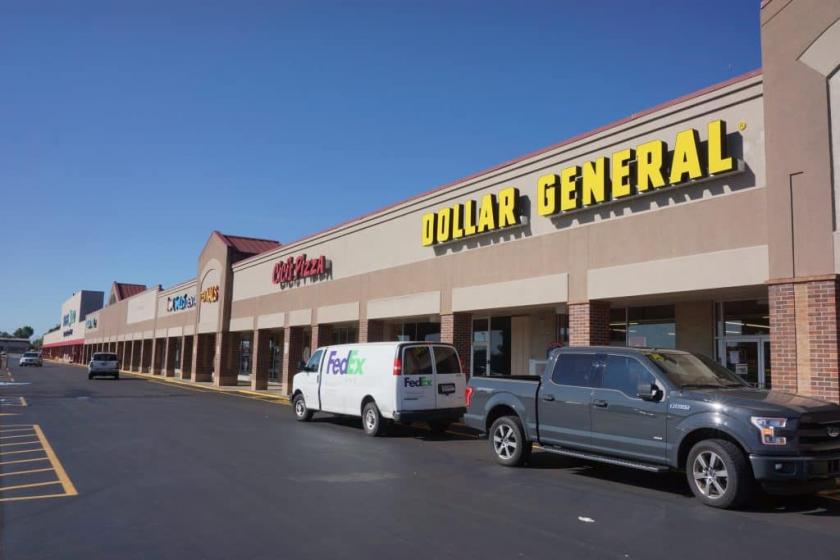
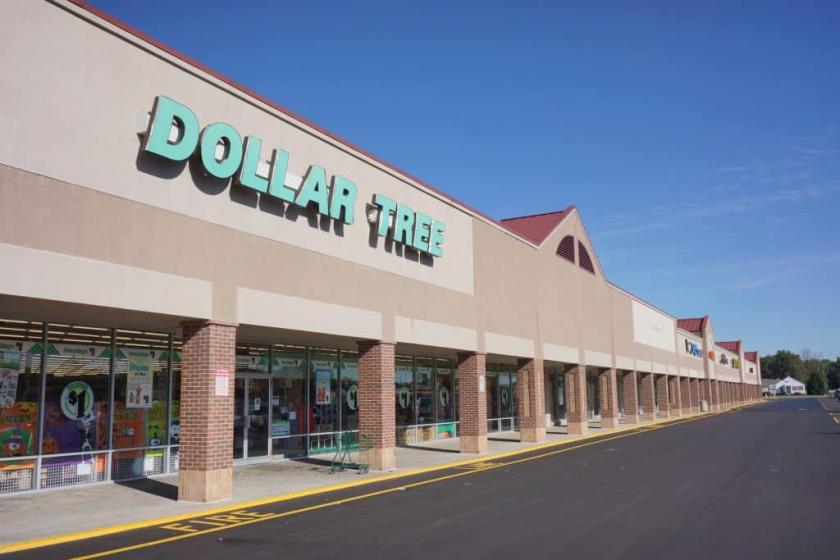
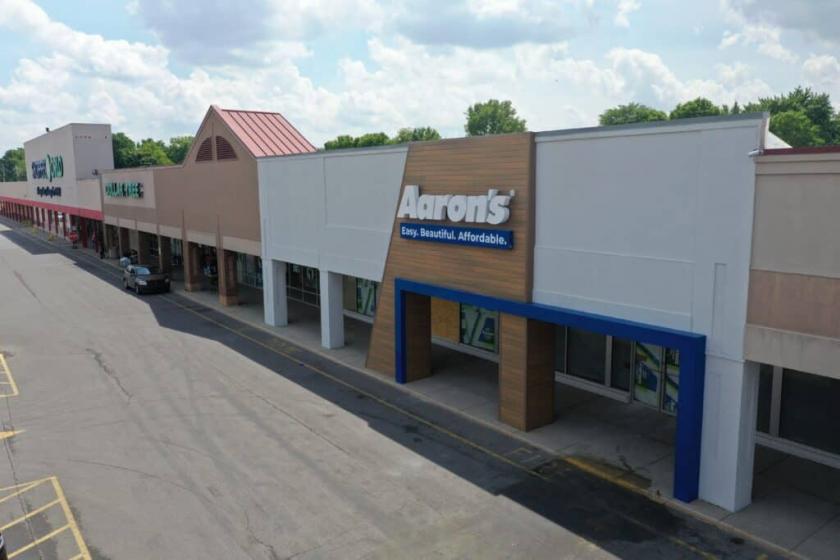
1-Mile | 3-Miles | 5-Miles | ||
---|---|---|---|---|
Total Population | 8,341 | 70,776 | 211,121 | |
Population Median Age | 35 | 37 | 36 | |
Population by Age | 0-9 Yrs | 1104 (13%) | 9656 (13%) | 28326 (13%) |
10-19 Yrs | 1281 (15%) | 8307 (11%) | 25222 (11%) | |
20-29 Yrs | 1489 (17%) | 12498 (17%) | 37915 (17%) | |
30-39 Yrs | 1249 (14%) | 10235 (14%) | 32499 (15%) | |
40-49 Yrs | 833 (9%) | 7381 (10%) | 23589 (11%) | |
50-59 Yrs | 906 (10%) | 9539 (13%) | 26511 (12%) | |
60-69 Yrs | 820 (9%) | 7414 (10%) | 20891 (9%) | |
70+ Yrs | 659 (7%) | 5746 (8%) | 16167 (7%) | |
Median HH Income | $36,651 | $41,263 | $43,528 | |
Total Household Income | < 24K | 1201 (37%) | 8125 (29%) | 23101 (28%) |
25-49K | 788 (24%) | 7950 (29%) | 22892 (27%) | |
50-74K | 638 (20%) | 4921 (18%) | 14973 (18%) | |
75-99K | 272 (8%) | 2879 (10%) | 8478 (10%) | |
100-199K | 245 (7%) | 2801 (10%) | 10454 (12%) | |
200K+ | 42 (1%) | 506 (1%) | 2056 (2%) | |
Highest Education Level | No Diploma | 952 | 9784 | 27619 |
Diploma or GED | 1909 | 16840 | 45217 | |
Some College | 948 | 8265 | 24852 | |
Assoc. Degree | 334 | 2990 | 8684 | |
Bachelors Degree | 622 | 6525 | 22779 | |
Higher Degree | 260 | 2926 | 12253 | |
Total Housing Units | 3,778 | 33,305 | 96,556 | |
--Owner-Occupied | 1,485 | 14,510 | 41,492 | |
--Renter-Occupied | 1,701 | 12,672 | 40,461 | |
Owner-Occupied Values | < 100K | 665 | 6659 | 16829 |
100-199K | 727 | 6263 | 17539 | |
200-299K | 66 | 1041 | 3918 | |
300-399K | 9 | 344 | 1737 | |
400-499K | 2 | 89 | 574 | |
500K+ | 17 | 112 | 894 | |
Total Working Age Population | 6,789 | 56,359 | 167,434 | |
In Work Force | 4,298 | 34,987 | 104,552 | |
Not In Work Force | 2,491 | 21,372 | 62,882 | |
Workforce Employed | 4,033 | 33,140 | 98,468 | |
Workforce Unemployed | 258 | 1,831 | 6,045 | |
Civlian Workforce | 4,291 | 34,971 | 104,512 | |
Military Workforce | 8 | 16 | 40 | |
Total Households | 3,185 | 27,182 | 81,954 | |
Family Households | 1,383 | 13,969 | 41,841 | |
Non-Family Households | 1,803 | 13,213 | 40,113 | |
Married Couple | 828 | 8,629 | 26,760 | |
Other Family | 555 | 5,340 | 15,081 | |
Married w/Child | 344 | 3,247 | 10,080 | |
Single Male w/Child | 94 | 892 | 1,966 | |
Single Female w/Child | 206 | 2,060 | 5,848 |
Population Change Last Two Decades - Plus Projection
2000 | % | 2010 | % | 2020 | % | 2030 | |
---|---|---|---|---|---|---|---|
Indiana | 6,080,485 | +7 | 6,483,802 | +4 | 6,738,573 | +4 | 7,014,880 |
Marion County | 860,454 | +5 | 903,393 | +7 | 963,732 | +4 | 1,001,231 |
Total Working Age Population:
Total Households:
Total Working Age Population:
Total Households:
Total Working Age Population:
Total Households: